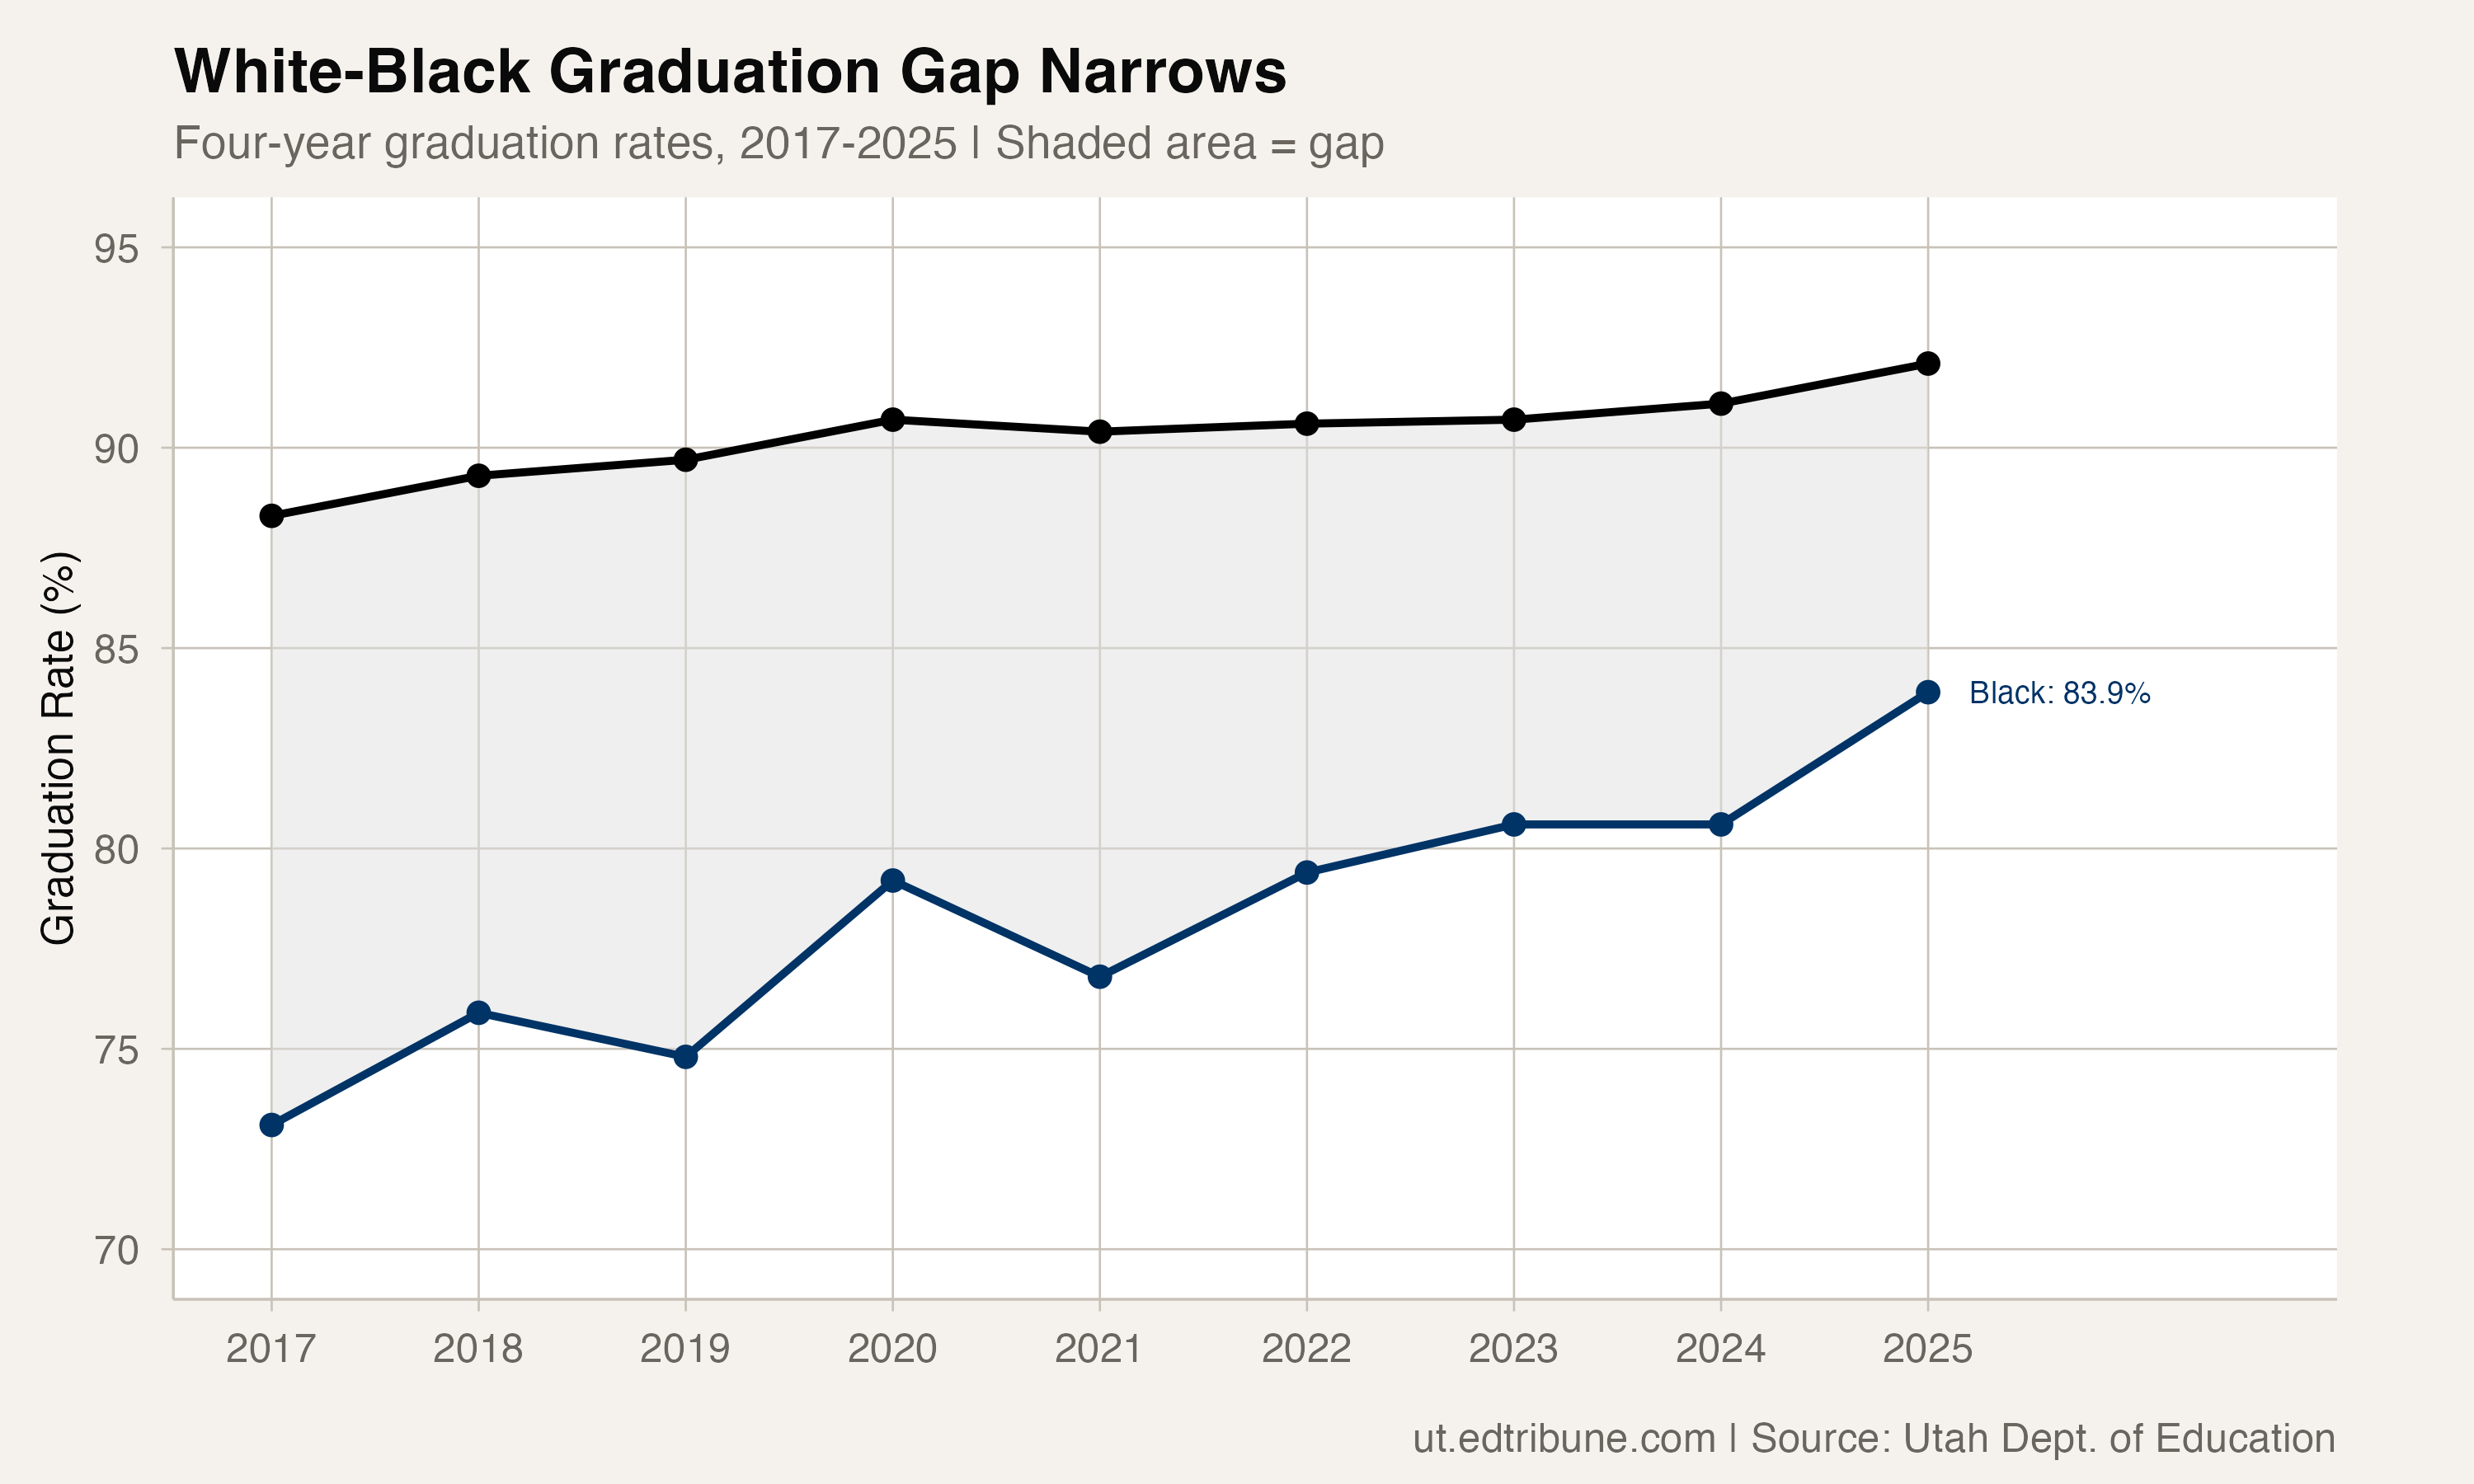
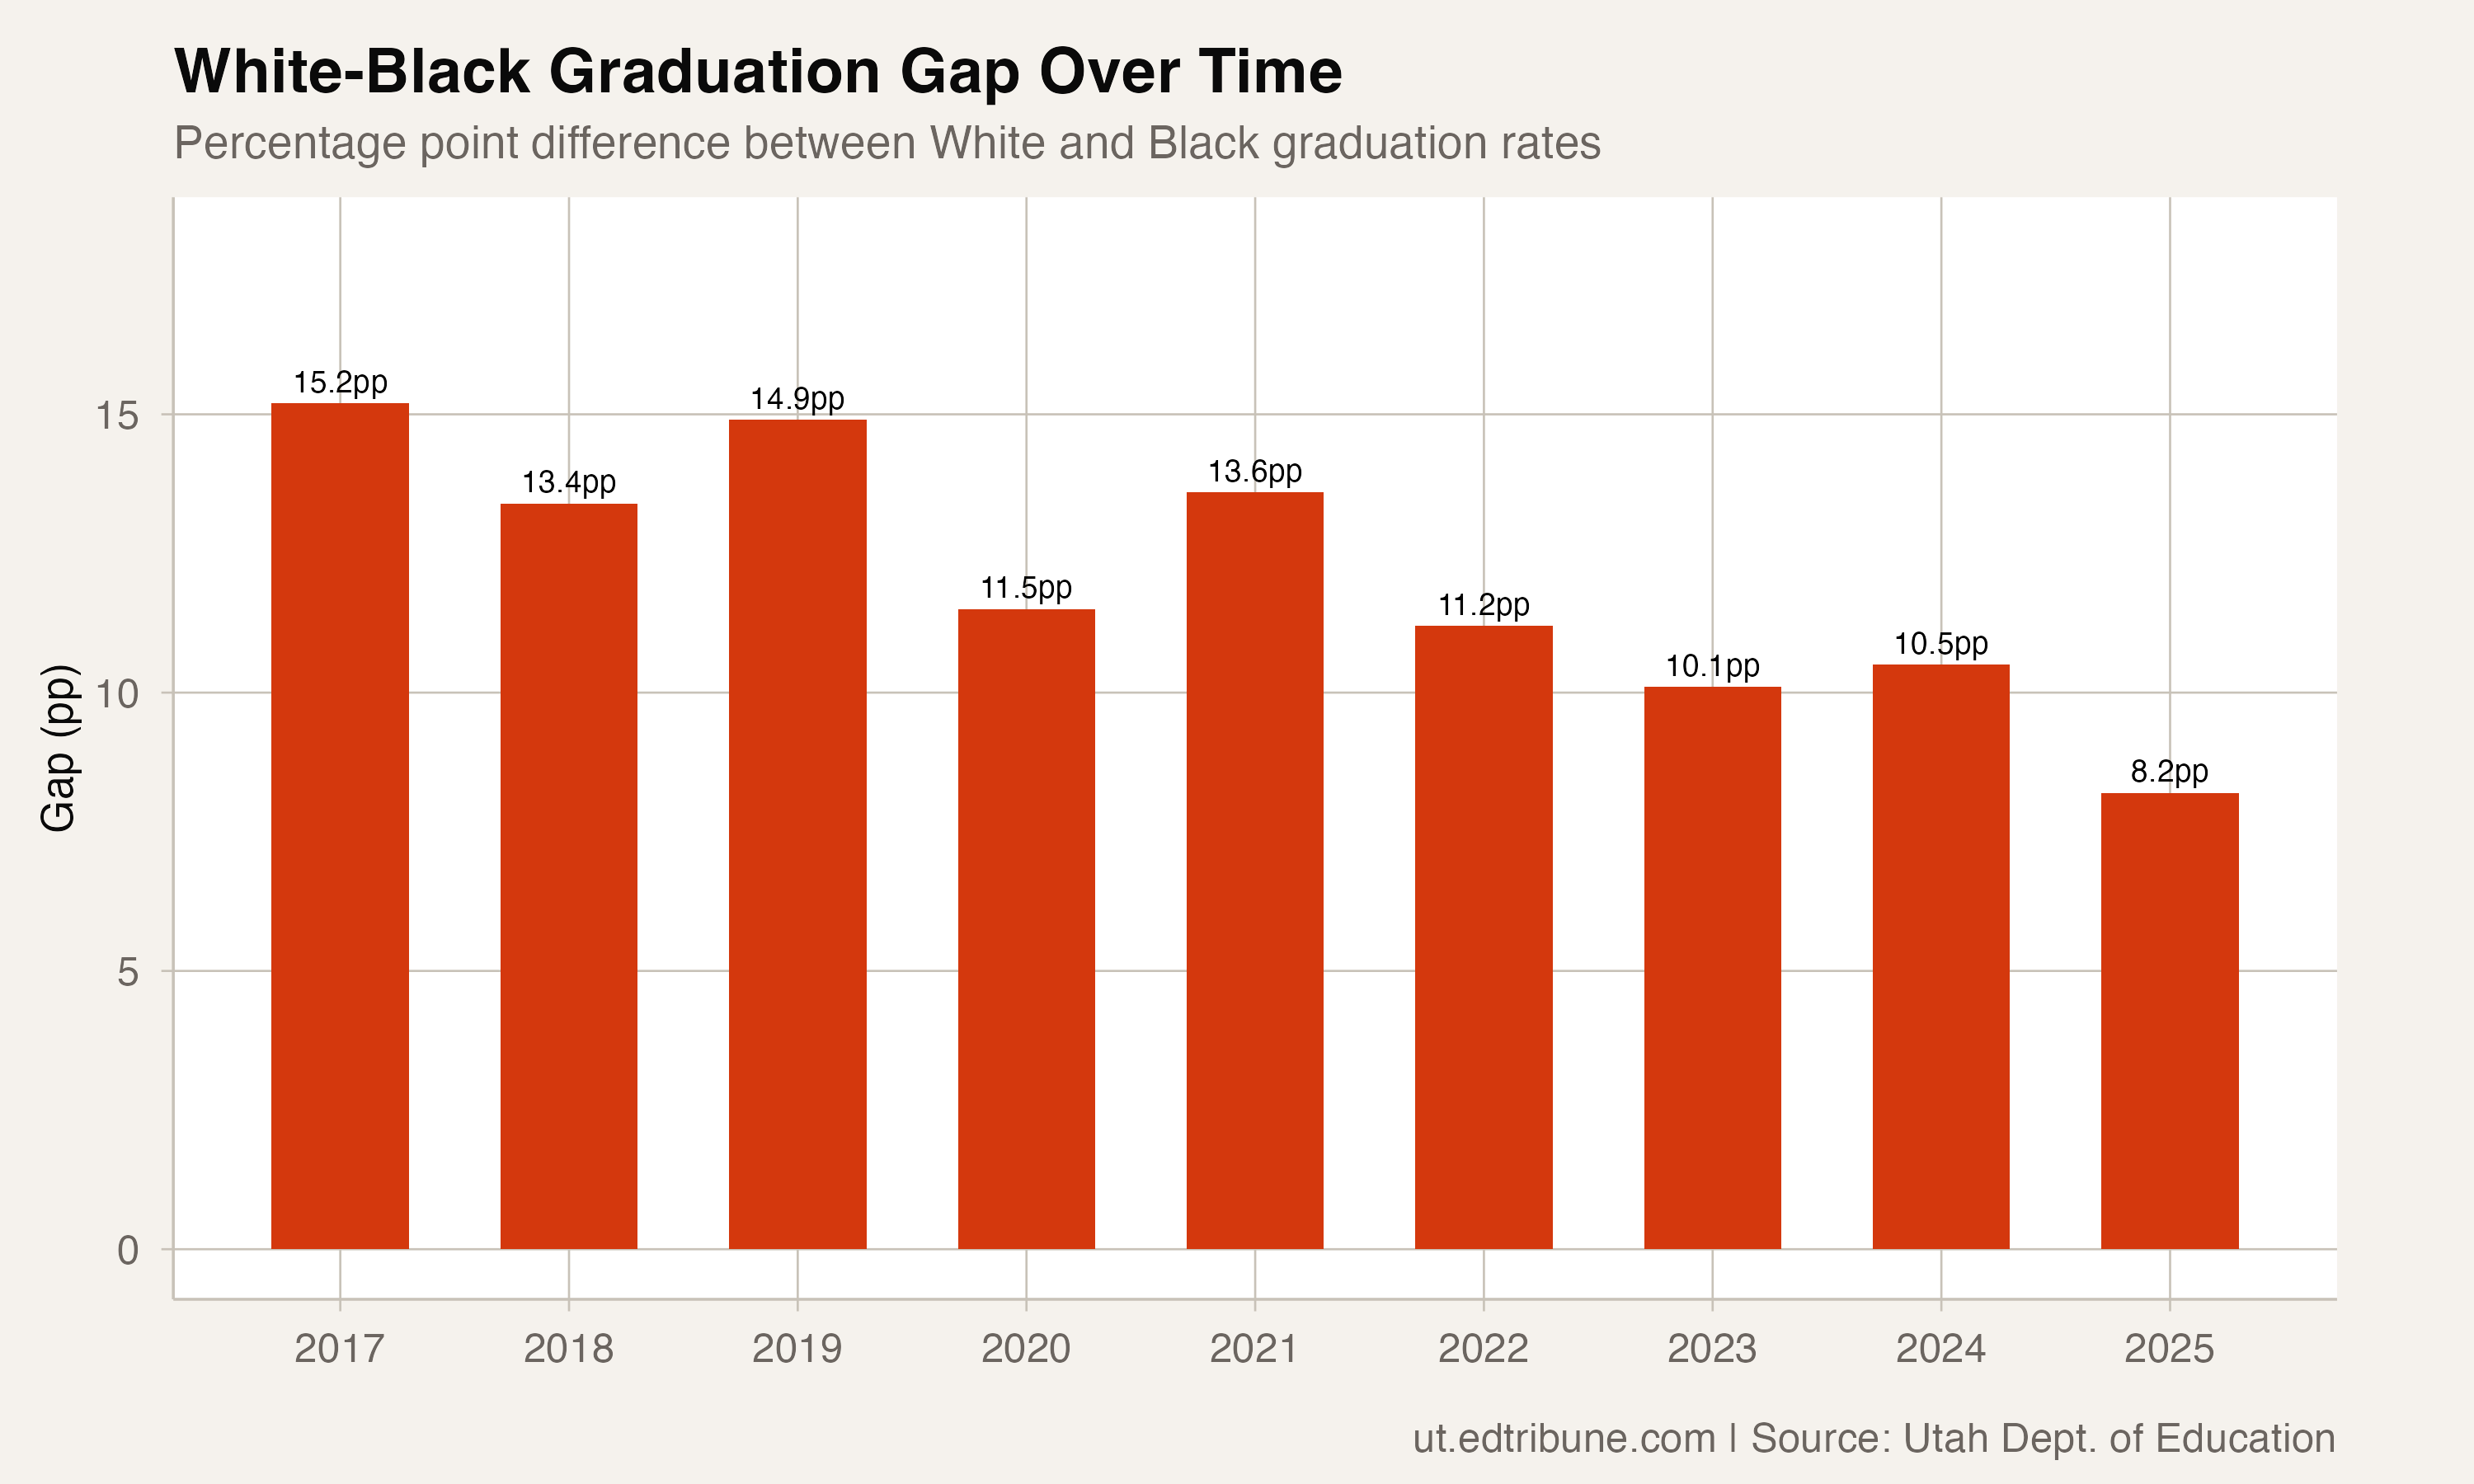
The gap was 15.2 percentage points in 2017. White students graduated at 88.3%, Black students at 73.1%. By any measure, it was one of Utah's starkest education disparities.
Eight years later, that gap has been nearly halved. Black students in Utah's Class of 2025 graduated at 83.9%. The 10.8 percentage point improvement outpaced White gains by almost three to one. The White-Black graduation gap now sits at 8.2 percentage points, still significant but a different order of magnitude from where it started.
The numbers behind the narrowing
What makes Utah's gap closure notable is how it happened. This wasn't a case of the top group stagnating while the bottom caught up. White graduation rates also improved, climbing from 88.3% to 92.1% over the same period, a 3.8 percentage point gain. Black students simply improved faster, at nearly triple the rate.
The 2025 jump was particularly striking. Black graduation rates leapt 3.3 percentage points in a single year, from 80.6% to 83.9%. Outside of the pandemic-era 2020 spike (+4.4 points, almost certainly inflated by emergency grading flexibilities), it is the largest single-year gain for Black students in the data series. That one-year jump alone accounted for nearly a third of the total eight-year improvement.
A volatile path
The improvement hasn't been linear. Black graduation rates have zigzagged considerably: up 2.8 points in 2018, down 1.1 in 2019, up 4.4 in 2020, down 2.4 in 2021. The year-to-year swings are partly an artifact of small cohort sizes (Black students make up roughly 1.3% of Utah's student population), where individual students can shift the rate by a full point.
The COVID year of 2020 actually saw a spike to 79.2%, likely reflecting pandemic-era grading flexibility. The subsequent drop to 76.8% in 2021 suggested those gains were partly artificial. Since then, the rate has climbed steadily, posting 79.4%, 80.6%, 80.6%, and finally 83.9%, representing real, sustained improvement rather than a statistical blip.
Context across subgroups
Black students posted the second-largest improvement of any subgroup in Utah, trailing only students who are English learners, who gained 12.1 percentage points over the same period. Students who receive special education services improved 7.6 points, Hispanic students 6 points.
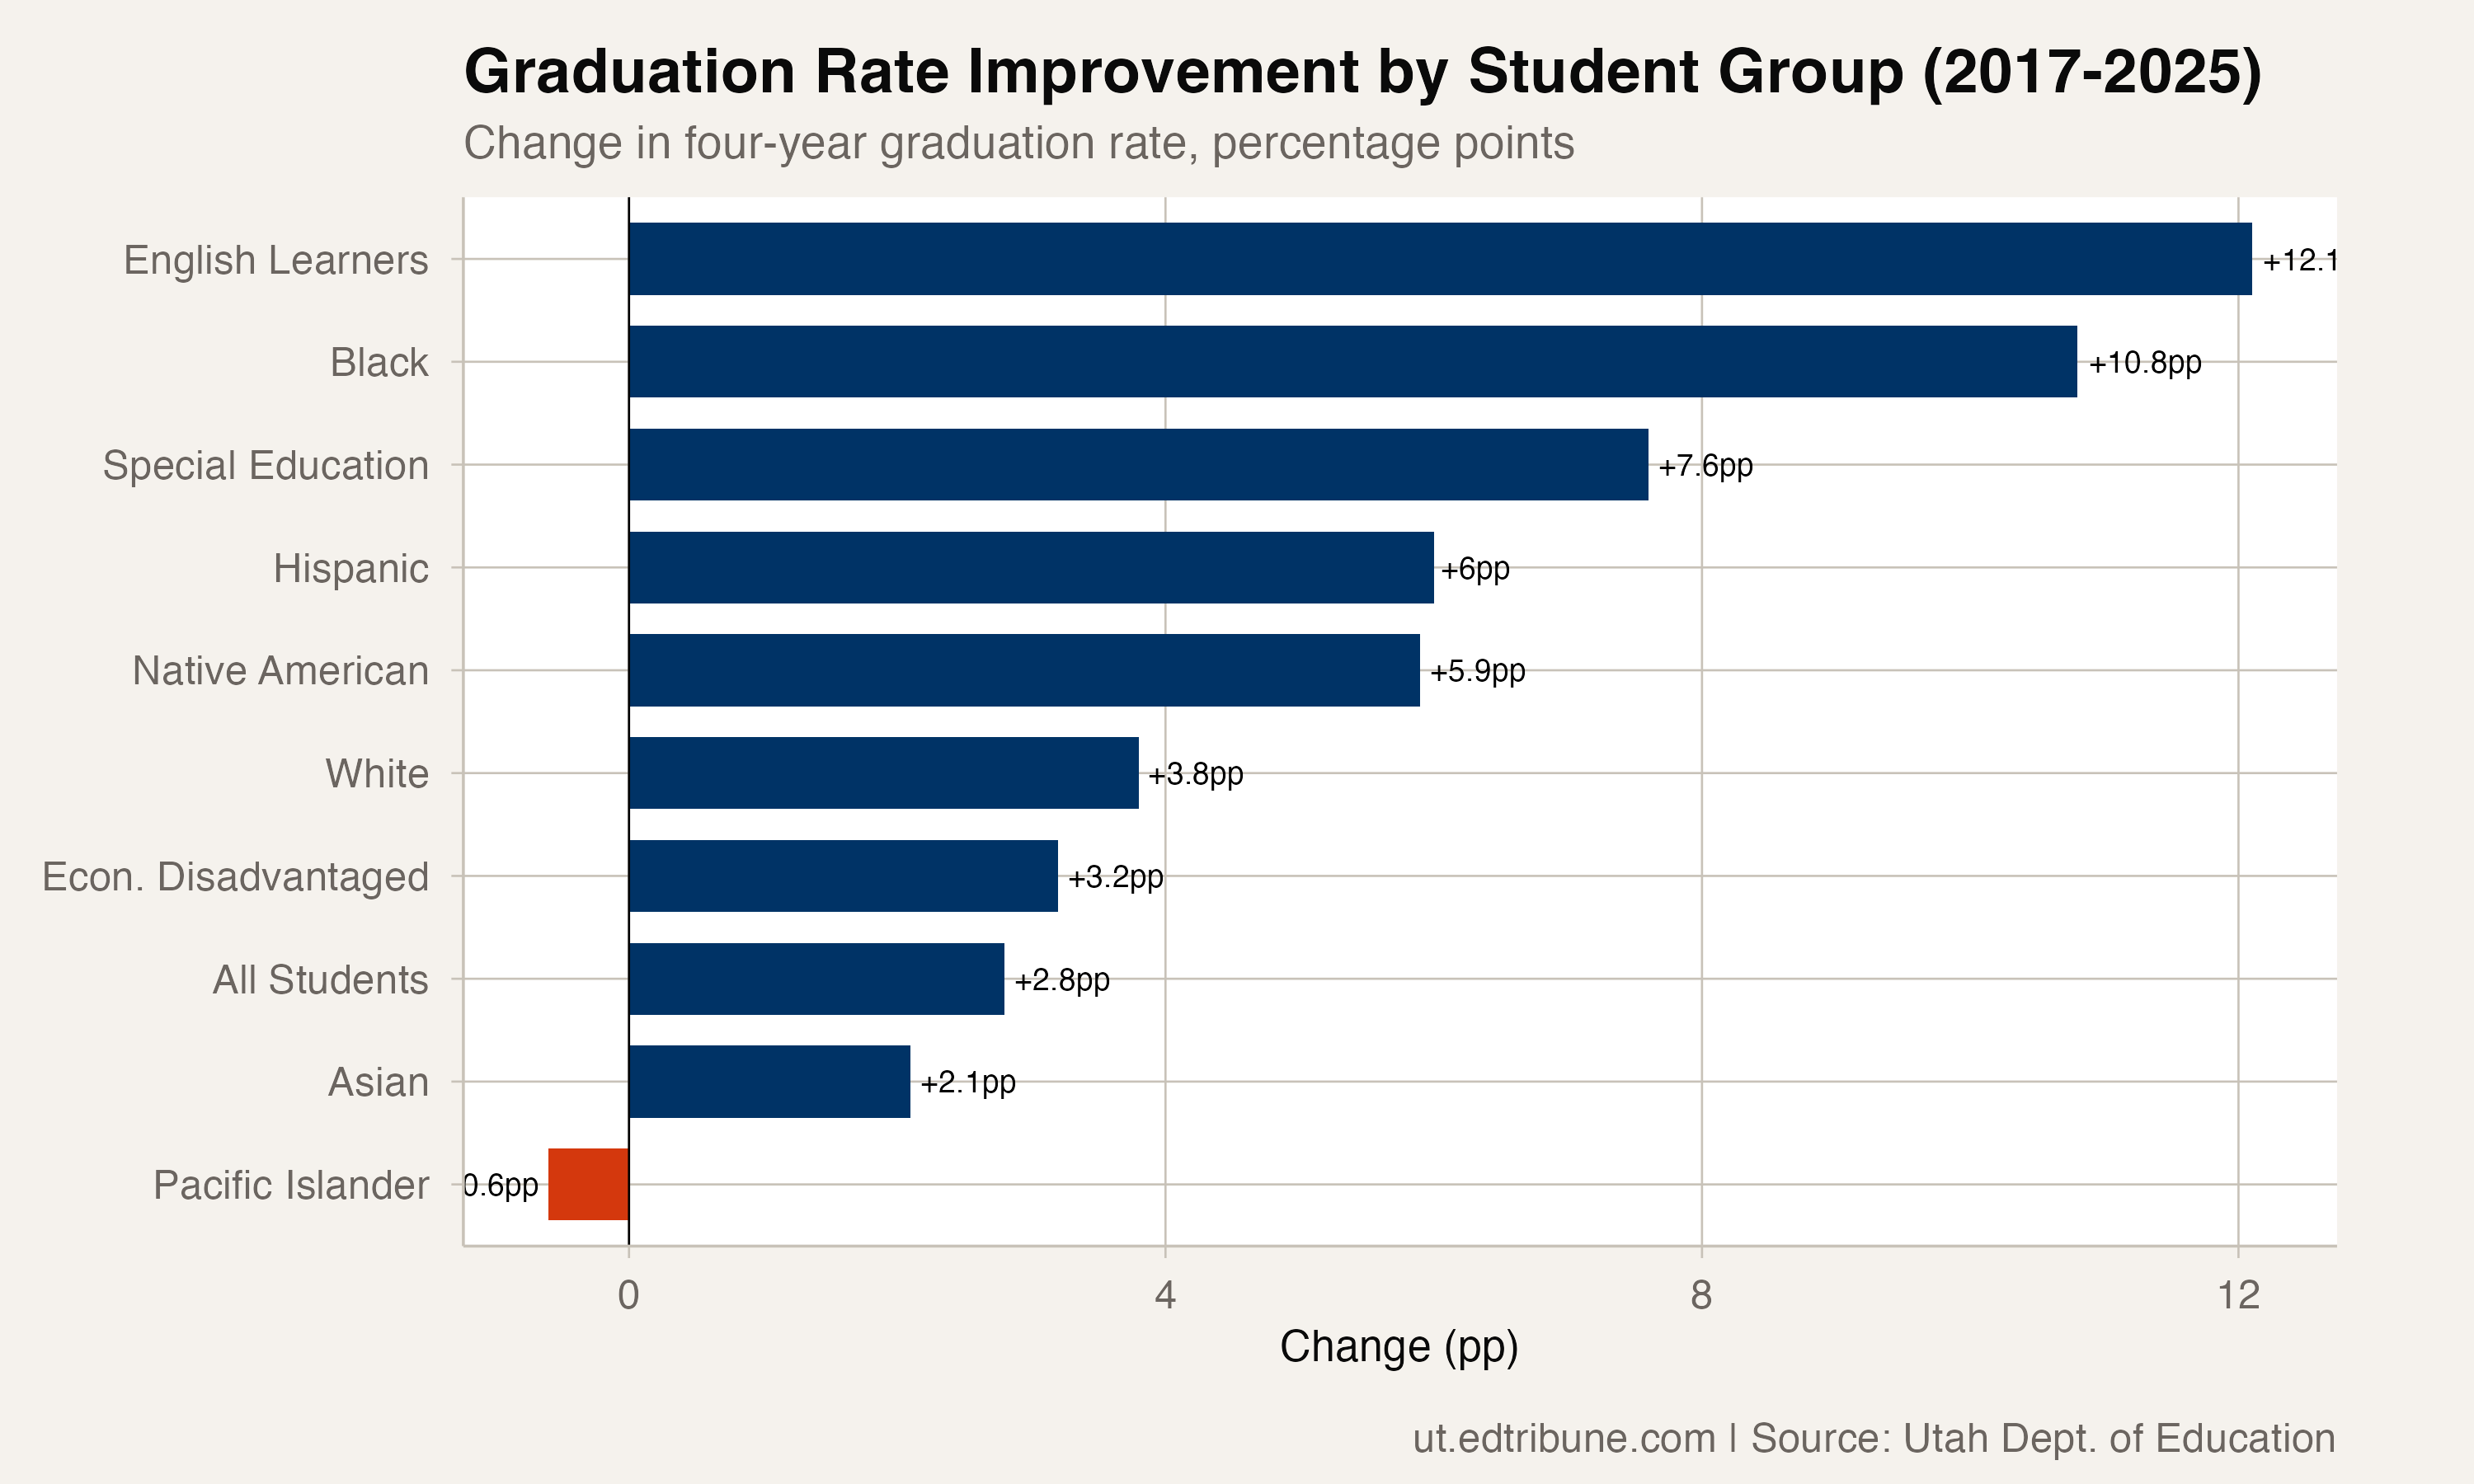
The only subgroup to see a decline was Pacific Islander students, whose rate slipped 0.6 points to 85%. Every other group improved.
The pattern suggests something systemic is working in Utah's approach to graduation; the gains are too broad-based to attribute to any single program. But the disproportionate improvement for Black students and English learners, the groups that started furthest behind, points to targeted interventions having their intended effect on top of whatever systemwide factors are at play.
What 83.9% means
At 83.9%, Utah's Black graduation rate now exceeds the overall graduation rate of several states. It's a genuine achievement, full stop. But the 8.2-point gap with White students means roughly 1 in 6 Black students still isn't graduating within four years, compared to fewer than 1 in 12 White students.
The question going forward is whether the 2025 acceleration represents a new trajectory or an outlier in a volatile series. If Black graduation rates hold above 83% and continue climbing, Utah could see the gap drop below 7 points within two or three years. If the pattern reverts to the zigzag of earlier years, the 2025 number may look like a peak rather than a plateau.
Either way, the direction is unmistakable. Utah's Black students are graduating at higher rates than at any point in the data, and the gap with their White peers is at its narrowest. The work isn't done, but the trend line says the work is working.
Data source
Data from the Utah State Board of Education. Four-year adjusted cohort graduation rates, 2017-2025.
Detailed code that reproduces the analysis and figures in this article is available exclusively to EdTribune subscribers.
Discussion
Sign in to join the discussion.
Loading comments...