Correction (May 31, 2026): An earlier version of this article contained four errors. The Asian students' 2025 rate is 1.8 points below their 2018 high of 92.4%, not 0.9 points. In 2017, six subgroups were below 80% (not four), as the article omitted economically disadvantaged students at 76.6% and Hispanic students at 77.3%. By 2025, three subgroups remain below 80% (not two), as the article omitted economically disadvantaged students at 79.8%. Black students crossed 80% in 2023, not 2022 (the 2022 rate was 79.4%). EdTribune regrets the errors.
Something unusual happened in Utah's Class of 2025 graduation data. Not one group improved. Not two. Eight of the ten student subgroups reported by the Utah State Board of Education reached their all-time highest four-year graduation rate.
White students. Black students. Hispanic students. English learners. Special education students. Native American students. Economically disadvantaged students. All students combined. Every one of them hit a peak they'd never reached before. The only exceptions were Asian students, who sit 1.8 points below their 2018 high of 92.4%, and Pacific Islander students, who sit 0.6 points below their 2017 level.
The breadth of improvement is what makes this cohort stand out. Individual subgroup gains come and go -- a good year for one group often coincides with a flat or declining year for another. Broad-based simultaneous improvement across nearly every demographic is rare enough to warrant examination.
The pattern: lowest start, fastest climb
The most striking feature of Utah's graduation trajectory isn't that everyone improved -- it's who improved the most.
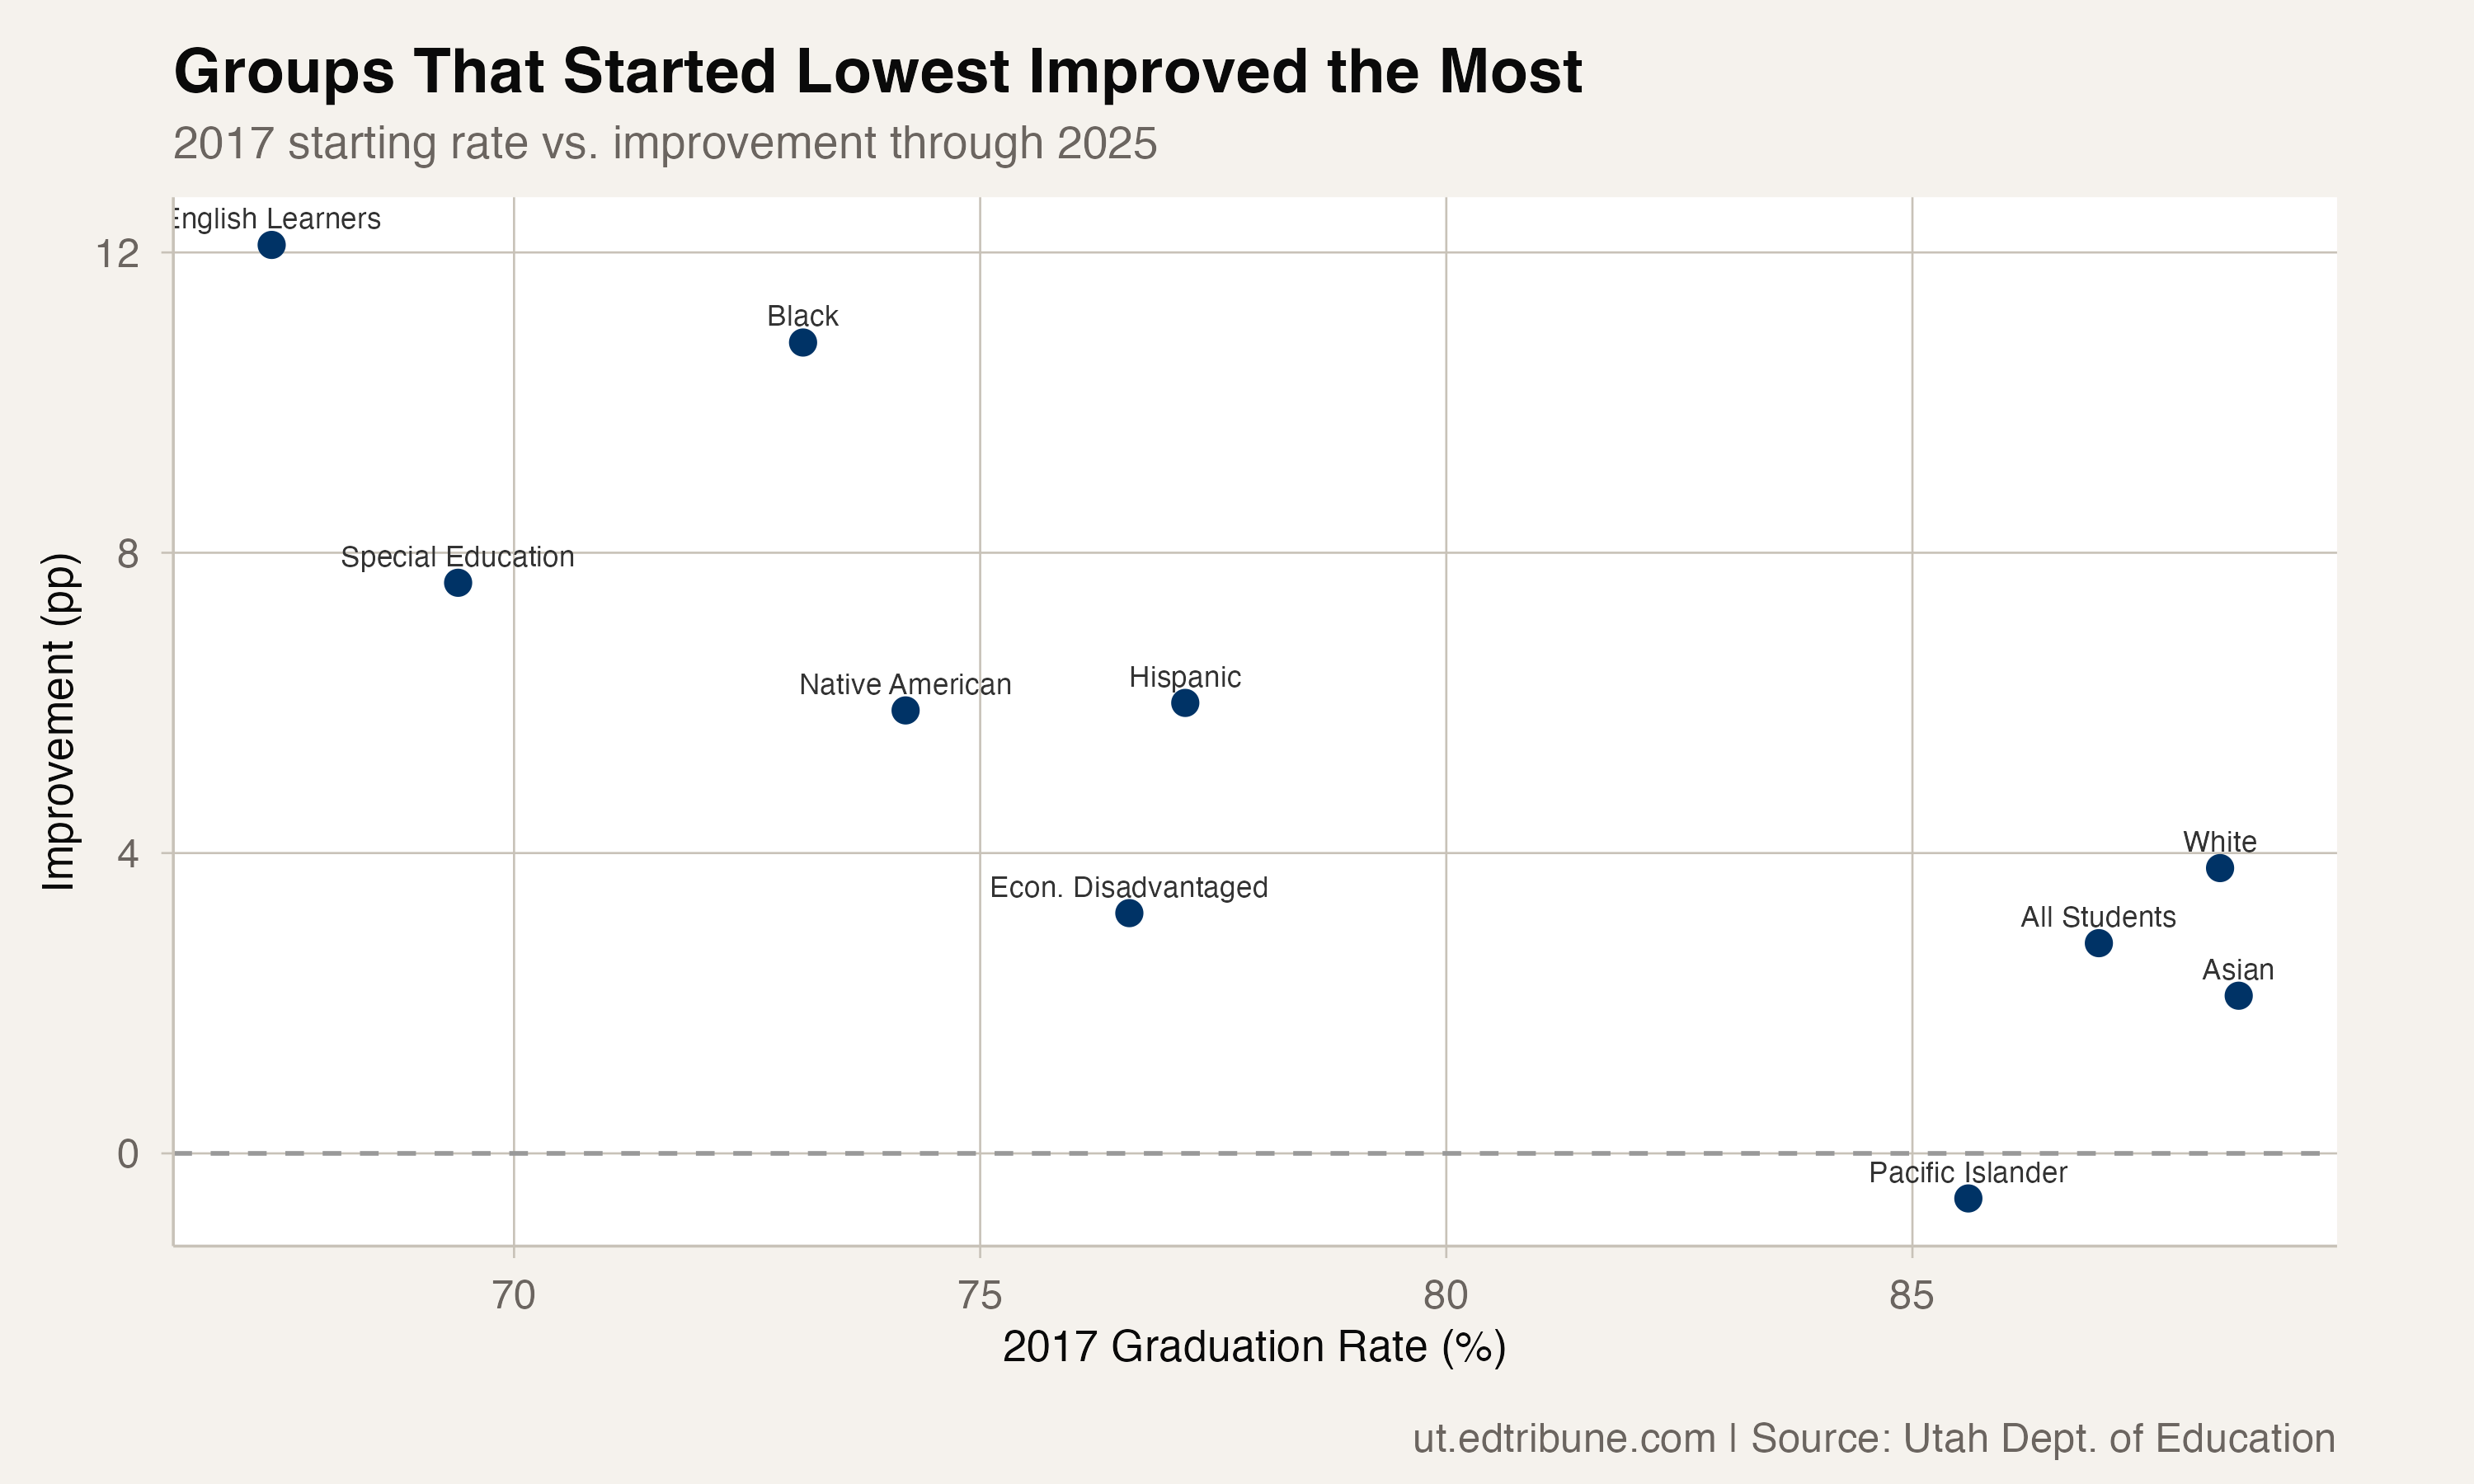
Since 2017, English learners gained 12.1 percentage points (67.4% to 79.5%). Black students gained 10.8 points (73.1% to 83.9%). Special education students gained 7.6 points (69.4% to 77%). These are the three groups that started below 75%, and they accounted for the three largest improvements.
Meanwhile, groups that started above 85% -- white students (+3.8pp), Asian students (+2.1pp), and Pacific Islander students (-0.6pp) -- showed modest gains or slight declines. This isn't surprising. A group already at 88% has less room to grow than one at 67%. But it's encouraging because it means the gaps are genuinely narrowing, not through top-group stagnation but through bottom-group acceleration.
2017 versus 2025
The side-by-side comparison tells the story in a single image.
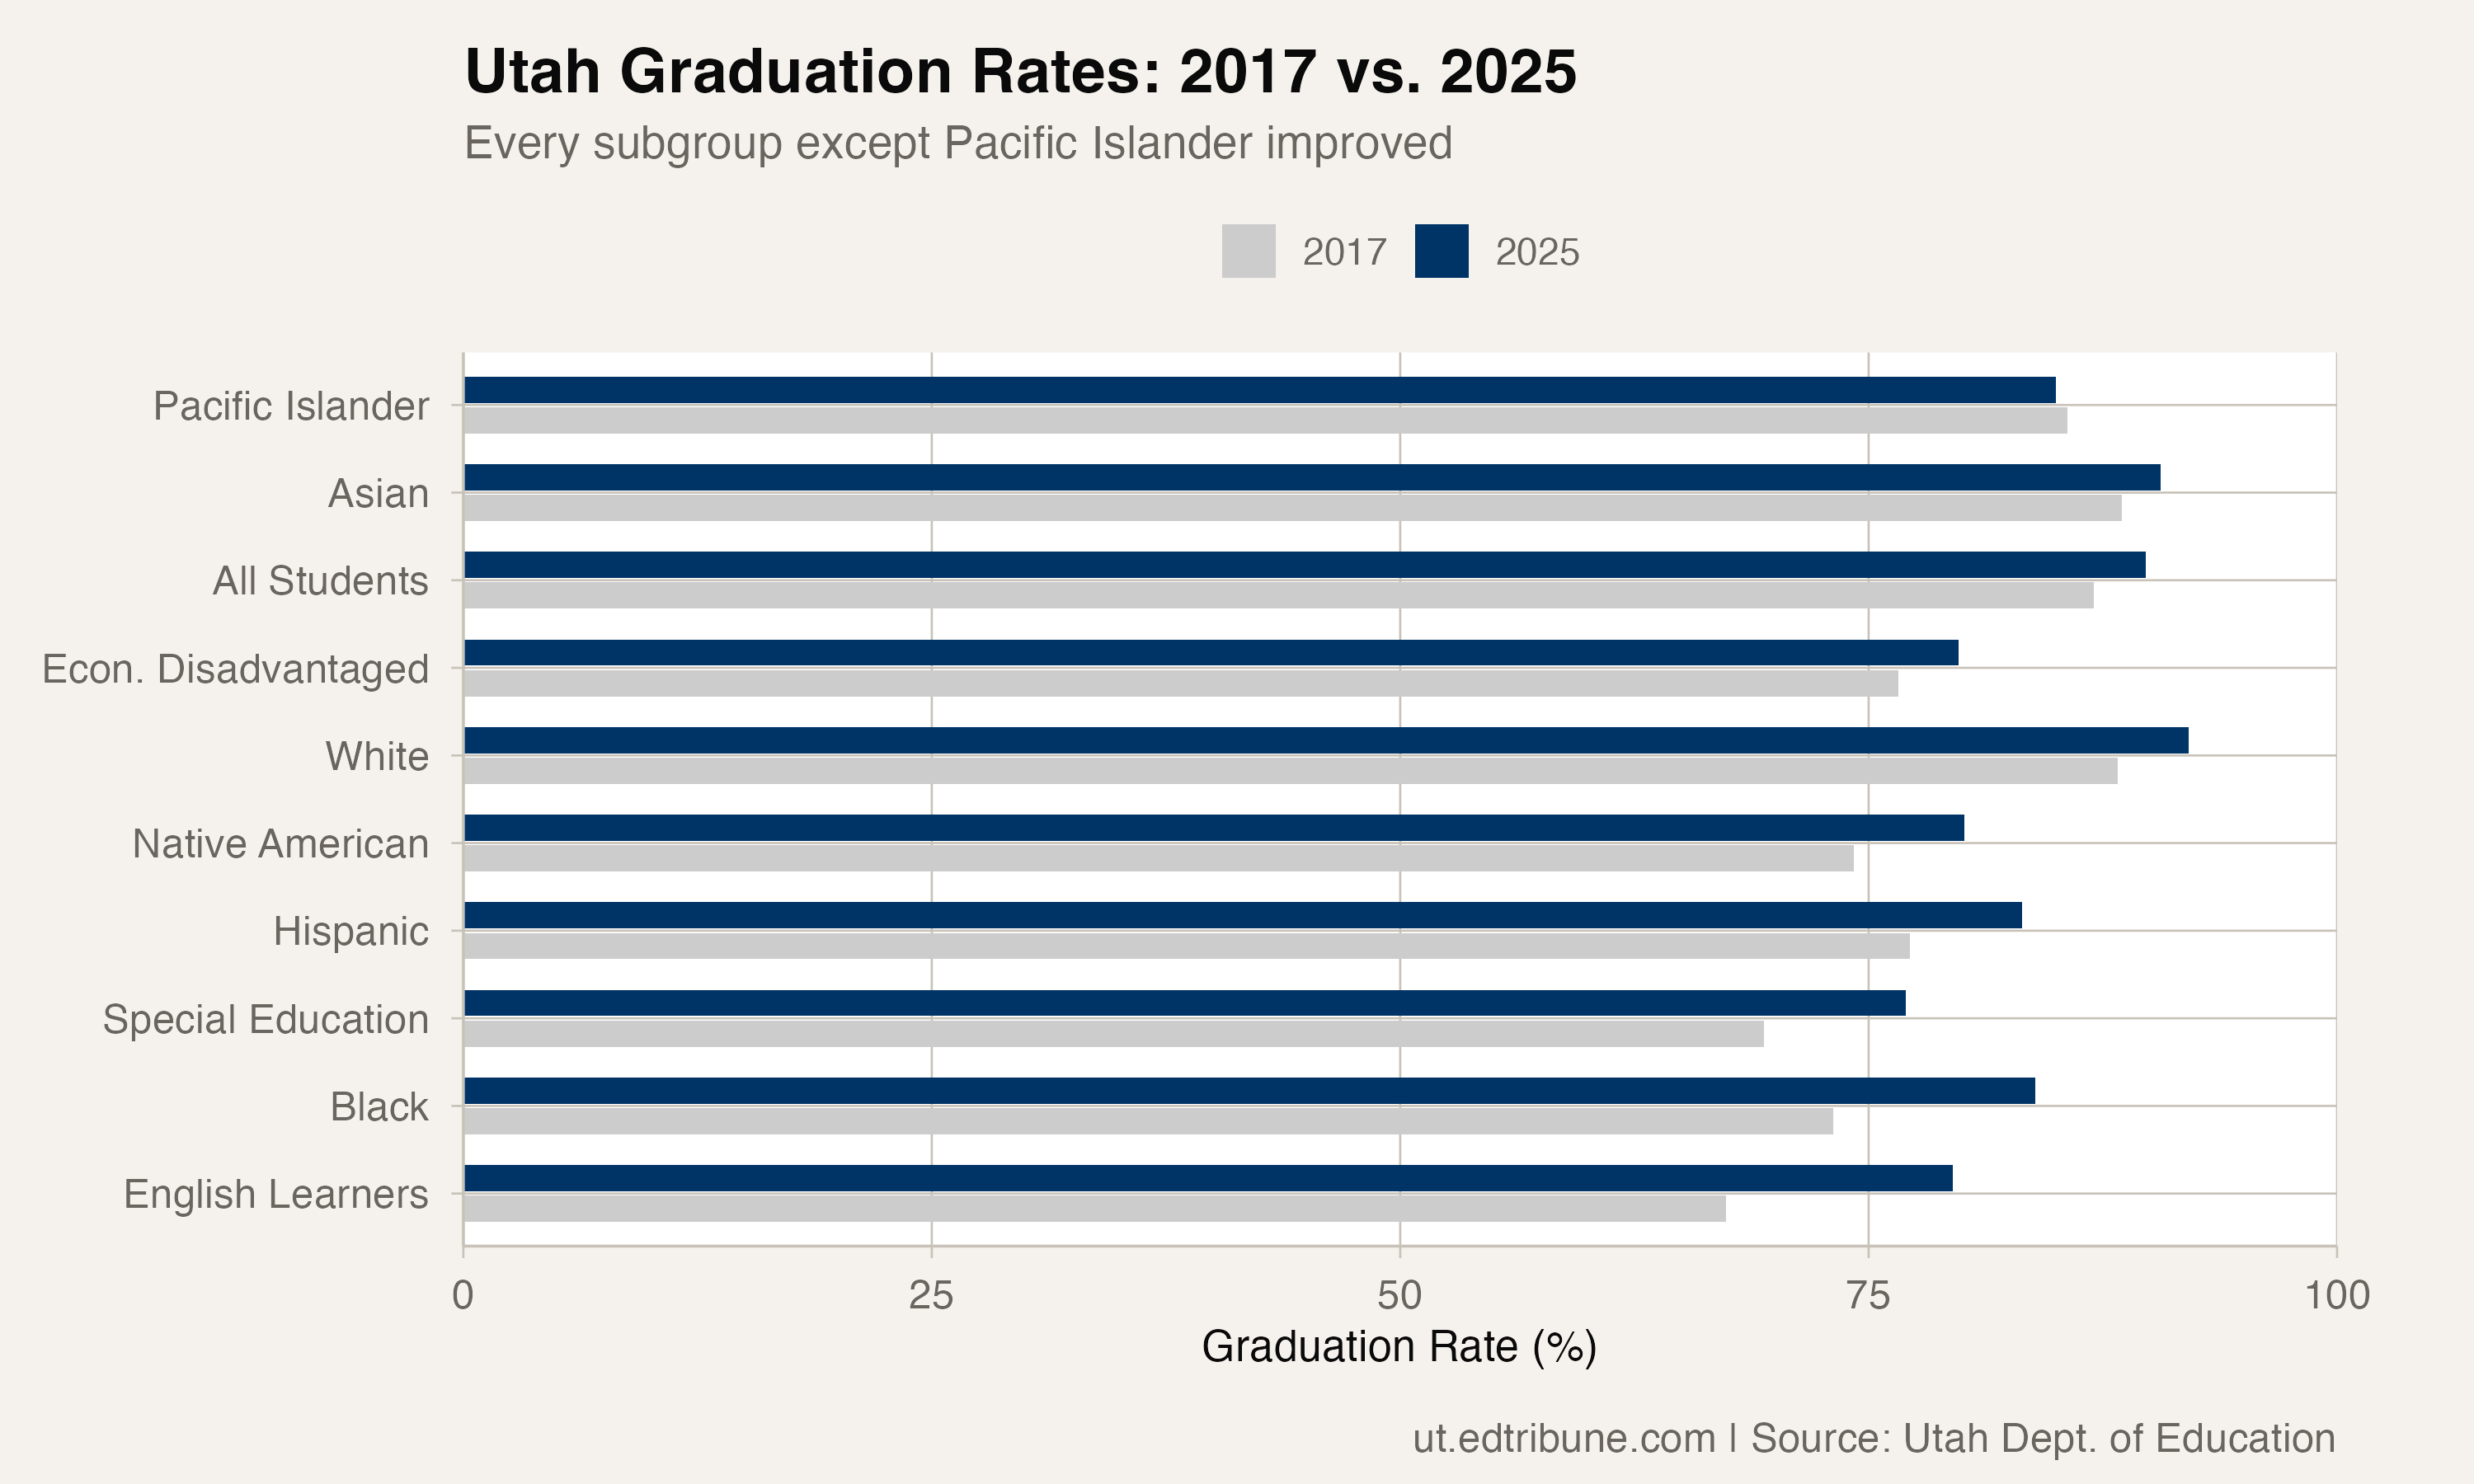
In 2017, six subgroups were below 80%: English learners (67.4%), students who receive special education services (69.4%), Black students (73.1%), Native American students (74.2%), economically disadvantaged students (76.6%), and Hispanic students (77.3%). By 2025, only three remain below 80%: students who receive special education services (77%), English learners (79.5%), and economically disadvantaged students (79.8%). Black students crossed 80% in 2023 and are now at 83.9%. Native American students crossed 80% for the first time in 2025.
The overall range has compressed. In 2017, the gap between the highest subgroup (Asian students at 88.5%) and the lowest (English learners at 67.4%) was 21.1 points. In 2025, the gap between the highest (White students at 92.1%) and lowest (students who receive special education services at 77%) is 15.1 points. Six points of compression in eight years.
The 2025 acceleration
The latest year was particularly strong. The overall state rate gained a full percentage point, the largest single-year increase in the available data going back to 2017. Black students jumped 3.3 points in one year. Pacific Islander students gained 3.1 points. Native American students added 2.6 points.
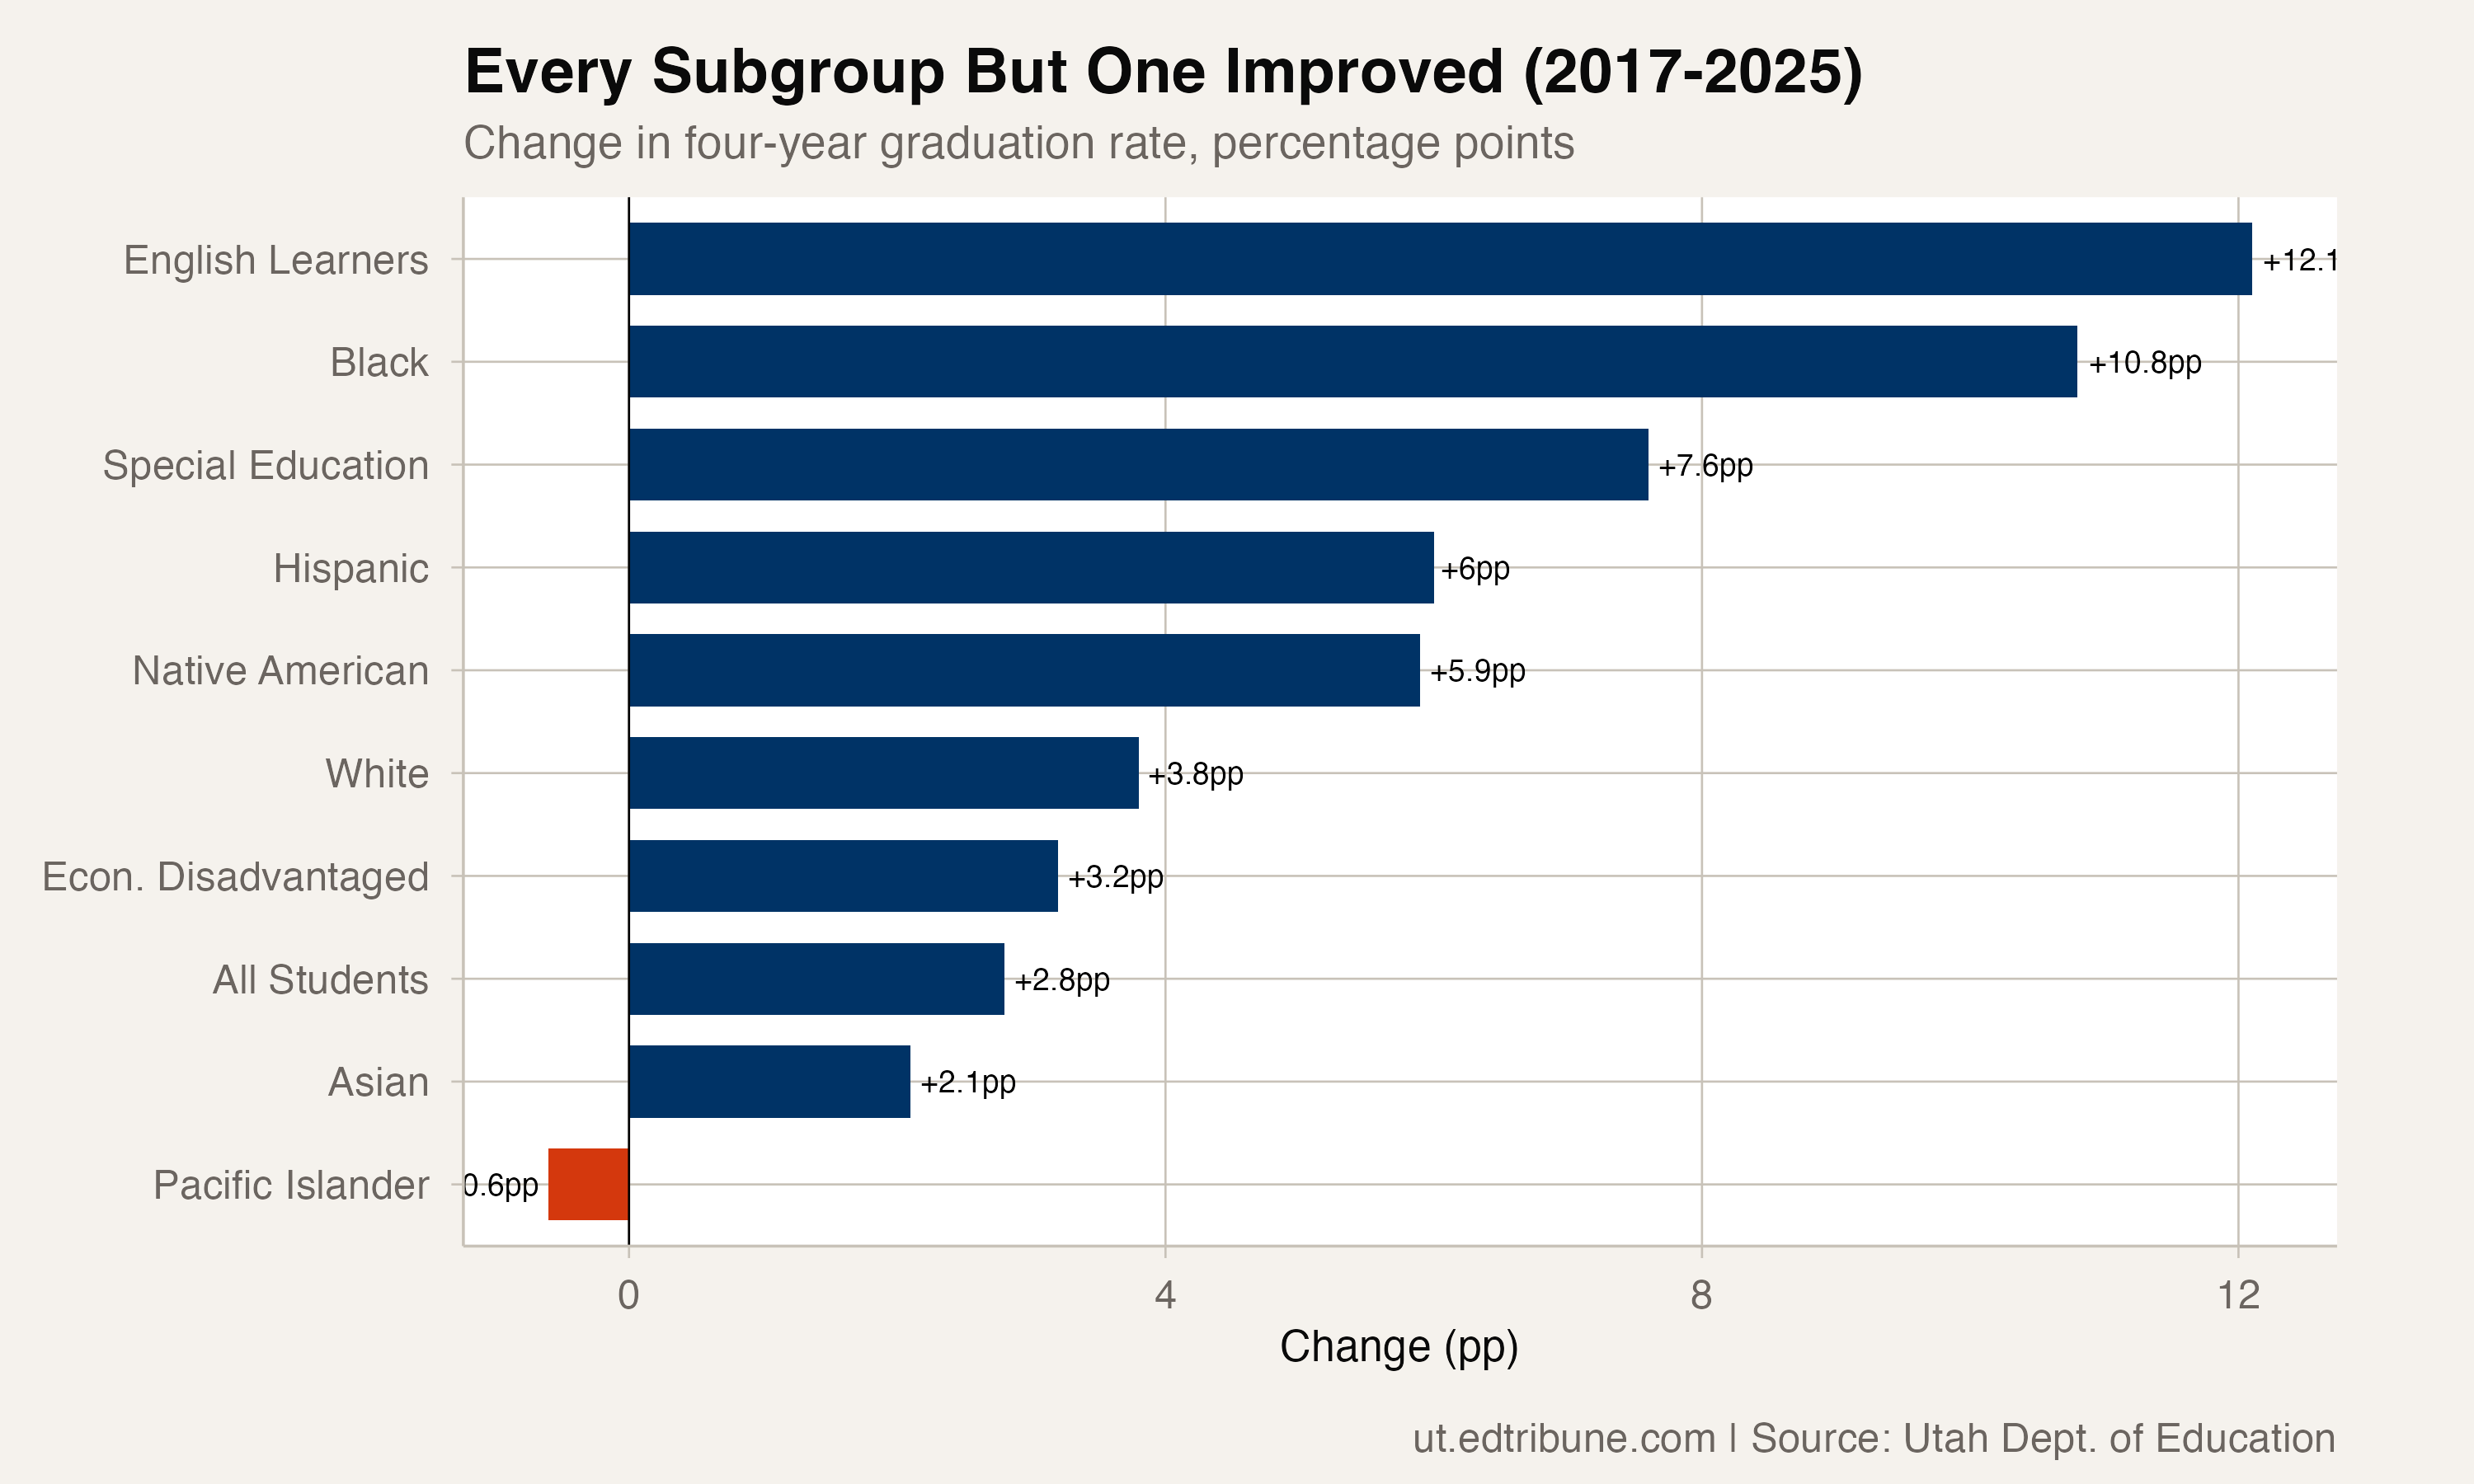
Only Asian students moved in the wrong direction, dipping 0.9 points from 91.5% to 90.6%. Even that decline is relative -- 90.6% is the second-highest rate of any subgroup.
The acceleration is significant because the 2021-2023 period had felt like a plateau. The overall rate inched from 88.1% to 88.3% over three years, with most subgroups showing similarly tiny movements. The 2024-2025 burst suggests that whatever was holding the rate flat has loosened.
What systemic improvement looks like
When a single subgroup improves, the credit usually goes to a targeted program. When eight of ten improve simultaneously -- and the three lowest-performing groups improve the fastest -- the explanation has to be systemic. Mentoring programs, family engagement, credit recovery options, school culture, funding levels: the gains are too broad to attribute to any single initiative.
That doesn't mean targeted programs don't matter. The 12.1-point improvement for English learners almost certainly reflects specific investments in language services, bilingual staffing, and family outreach. The 10.8-point gain for Black students likely reflects intentional equity work. But those targeted efforts are succeeding inside a system that's also lifting every other group.
The risk in this kind of broad-based improvement is complacency. When everything is going up, it's easy to assume the work is done. But special education students still graduate at 77% -- nearly one in four don't earn a diploma in four years. English learners are at 79.5%. Economically disadvantaged students are at 79.8%. These rates are better than they've ever been, and they're still not good enough.
Eight all-time highs in a single year is a remarkable achievement. The question is whether Utah treats it as a destination or a waypoint.
Data from the Utah State Board of Education. Four-year adjusted cohort graduation rates, 2017-2025.
Detailed code that reproduces the analysis and figures in this article is available exclusively to EdTribune subscribers.
Discussion
Sign in to join the discussion.
Loading comments...