Tuesday, July 14, 2026

Native American Graduation Rates Cross 80% for the First Time in Utah -- But Still Trail the State by Nearly 10 Points

Utah's Native American graduation rate crossed 80% for the first time in 2025, reaching 80.1%, but the volatile trajectory and 9.7-point gap to the state average tell a more complex story.

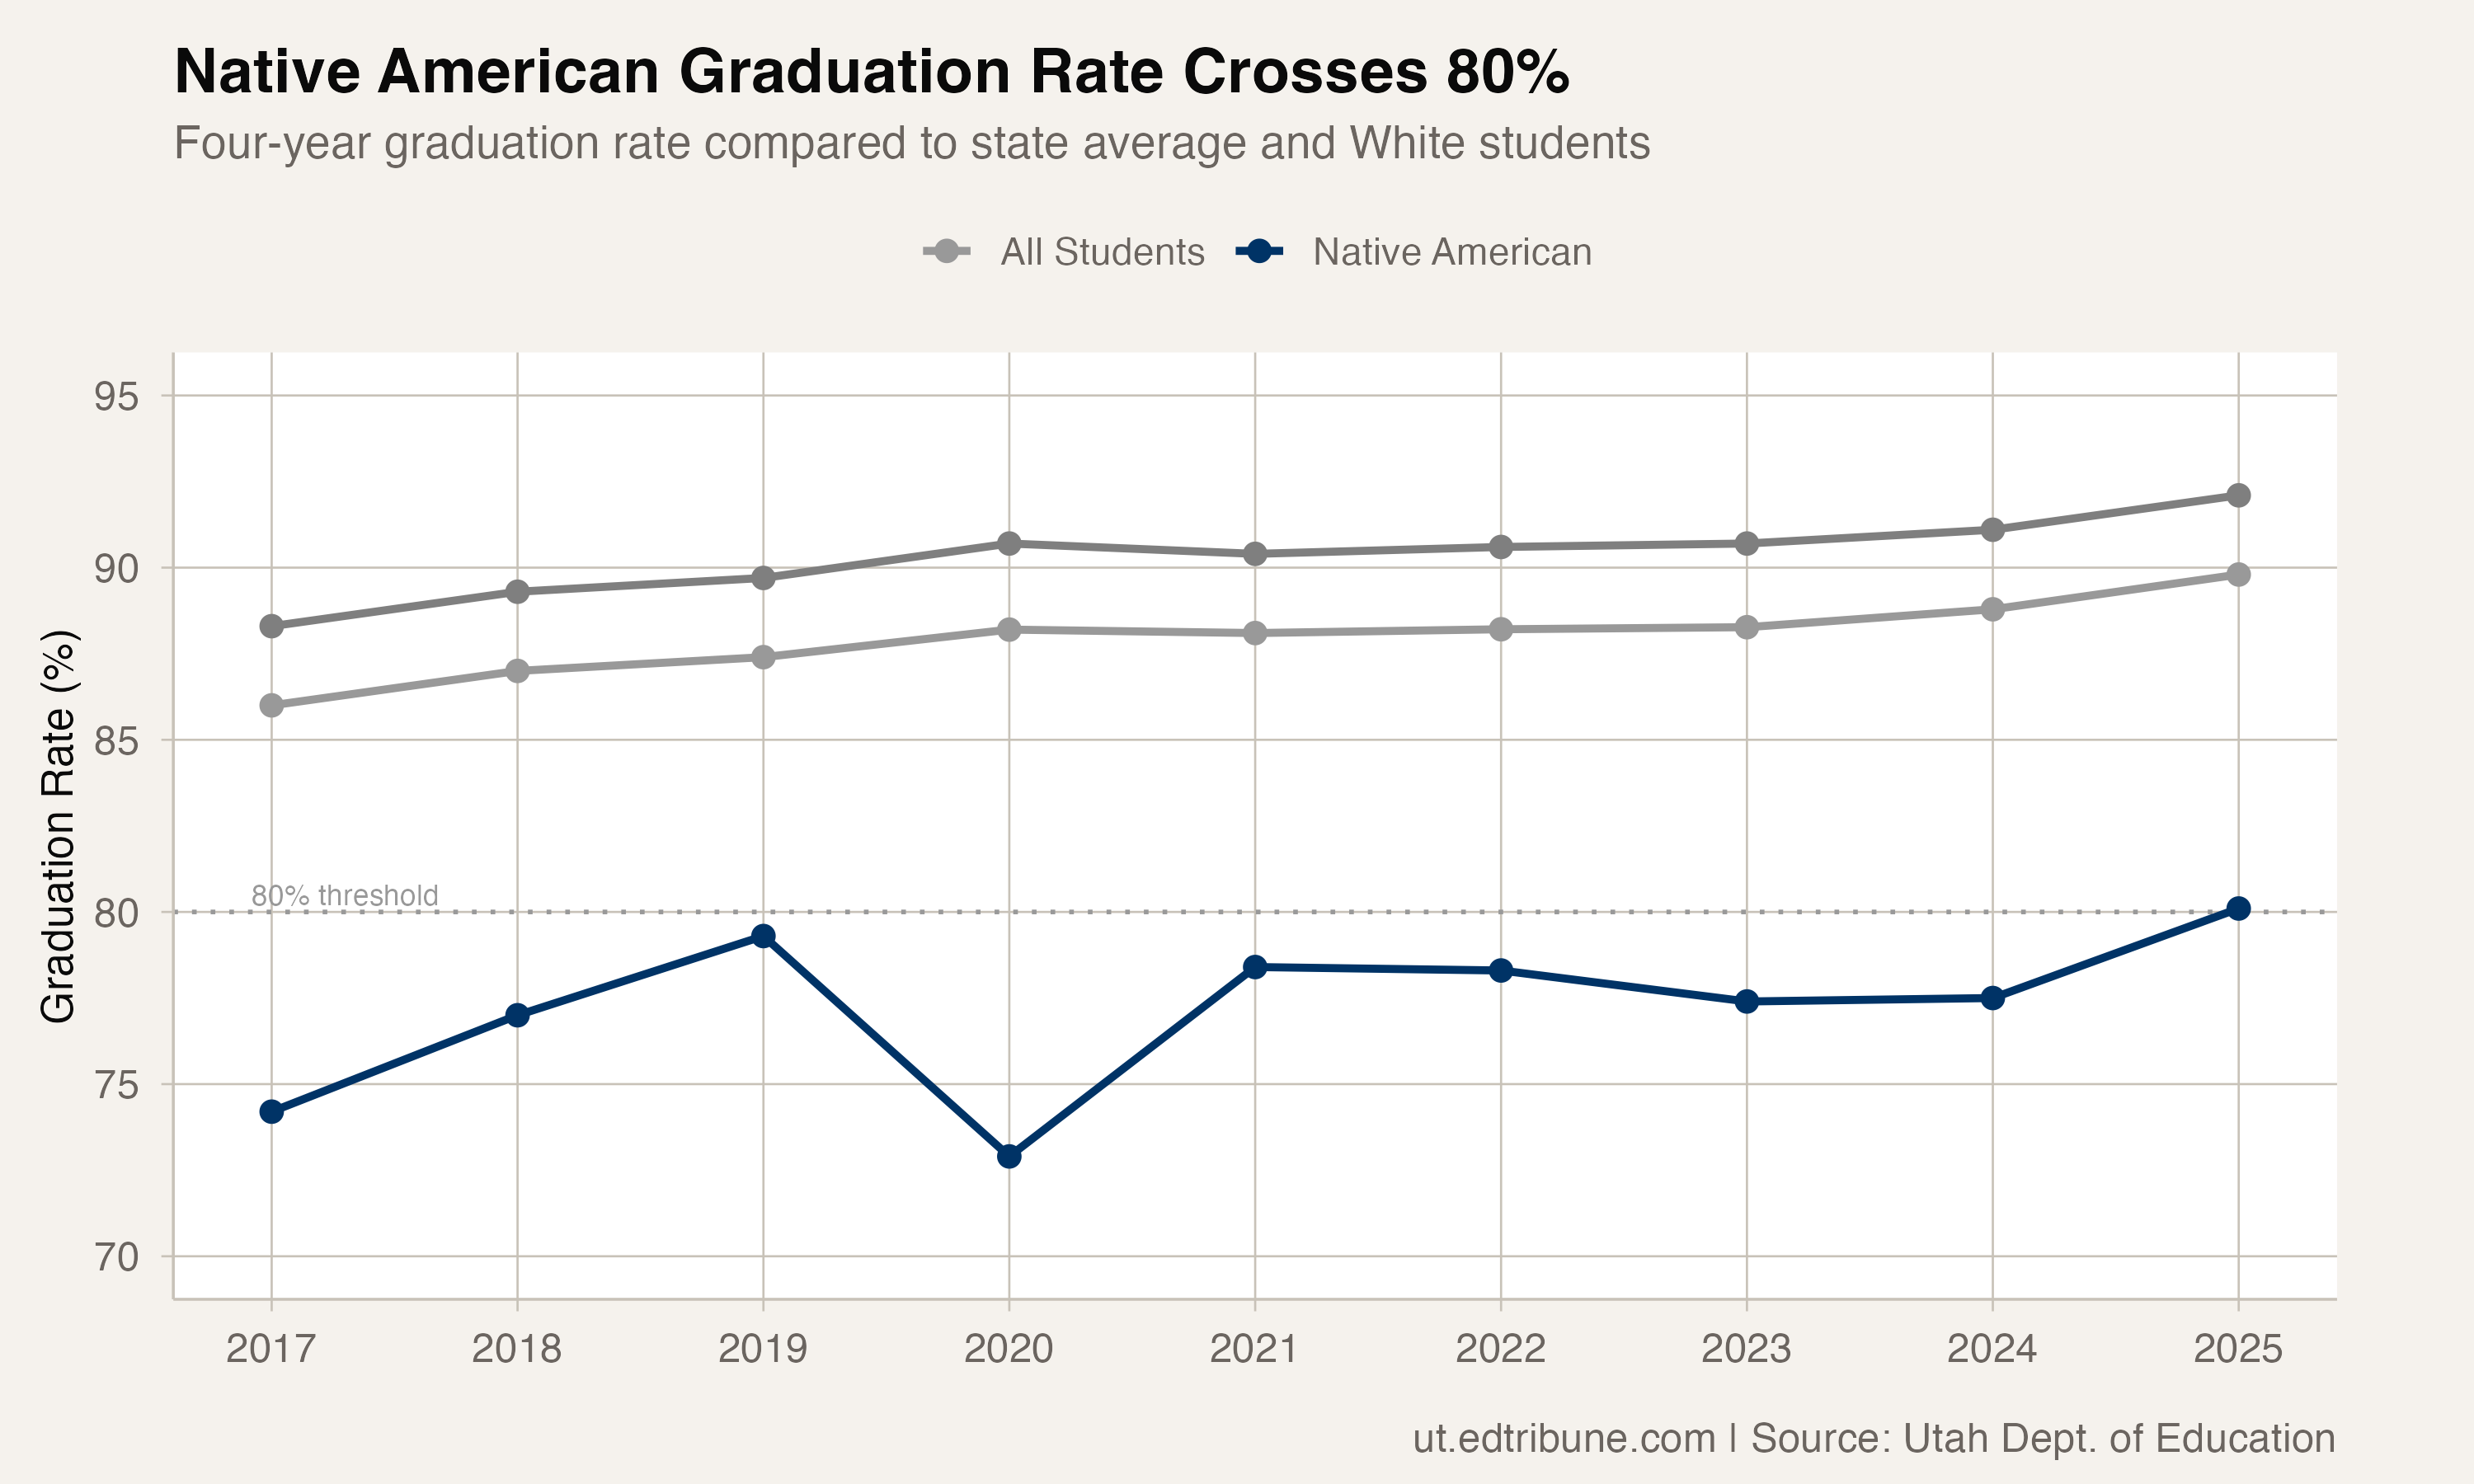
Utah's Native American four-year graduation rate crossed 80% in 2025 for the first time on record. The Class of 2025 graduated at 80.1%, up from 74.2% in 2017 -- a 5.9 percentage point gain over eight years.

The milestone is real and worth noting. But the path to get here has been anything but steady, and the 9.7-point gap between Native American students and the state average of 89.8% remains one of Utah's widest equity divides.

Native American graduation rate vs. state average and White students

Volatility is the defining feature

Unlike English learners, who improved every year without exception, or Black students, whose gains were large if uneven, Native American graduation rates have zigged and zagged with alarming amplitude.

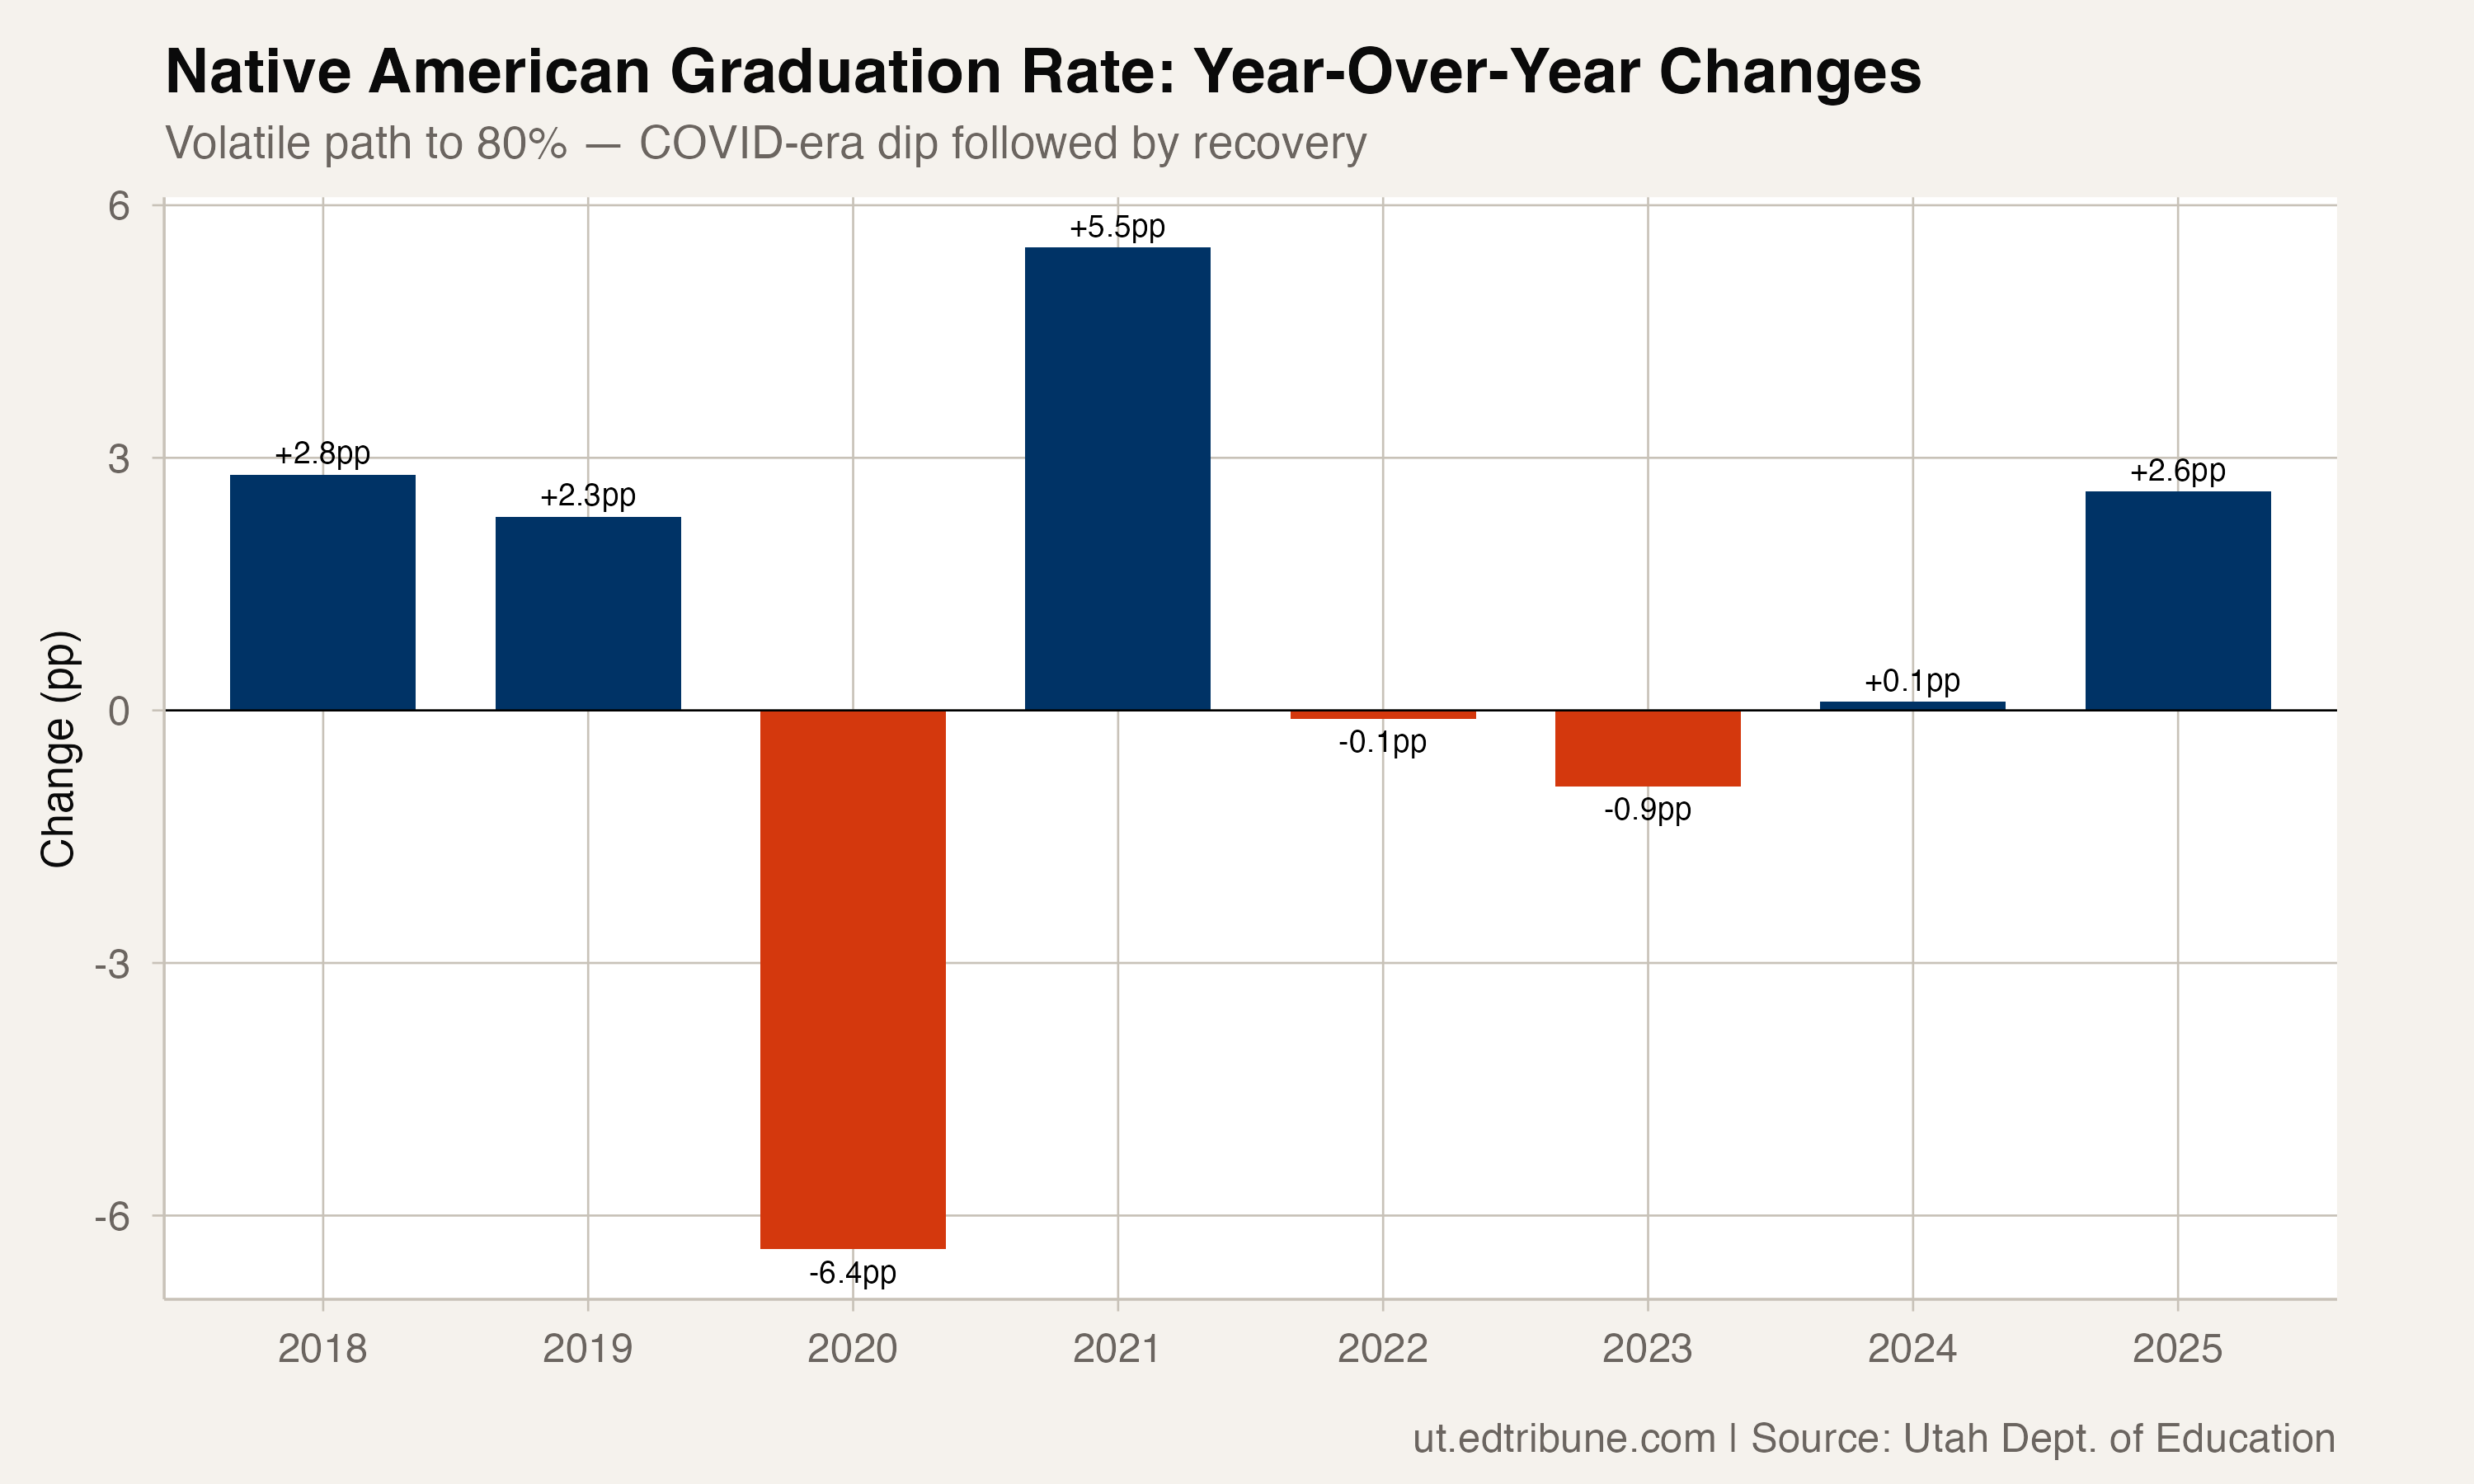
The pattern: 74.2% in 2017, up to 77% and 79.3% in the next two years. Then the COVID year of 2020 cratered the rate to 72.9% -- a 6.4-point single-year drop that erased three years of progress. Recovery brought the rate back to 78.4% in 2021, but it then drifted down again: 78.3%, 77.4%, 77.5%. Only in 2025 did it finally clear 80%.

Year-over-year changes

The swings are partly statistical. Native American students make up roughly 1.3% of Utah's student population. In small cohorts, individual students can shift the rate by a point or more. But the COVID dip of 6.4 points -- the largest for any subgroup in 2020 -- suggests something beyond statistical noise. Many of Utah's Native American students attend schools in remote areas of the Navajo Nation and Ute reservations, where pandemic impacts on connectivity, health, and family stability were severe.

Three gaps, none closing fast

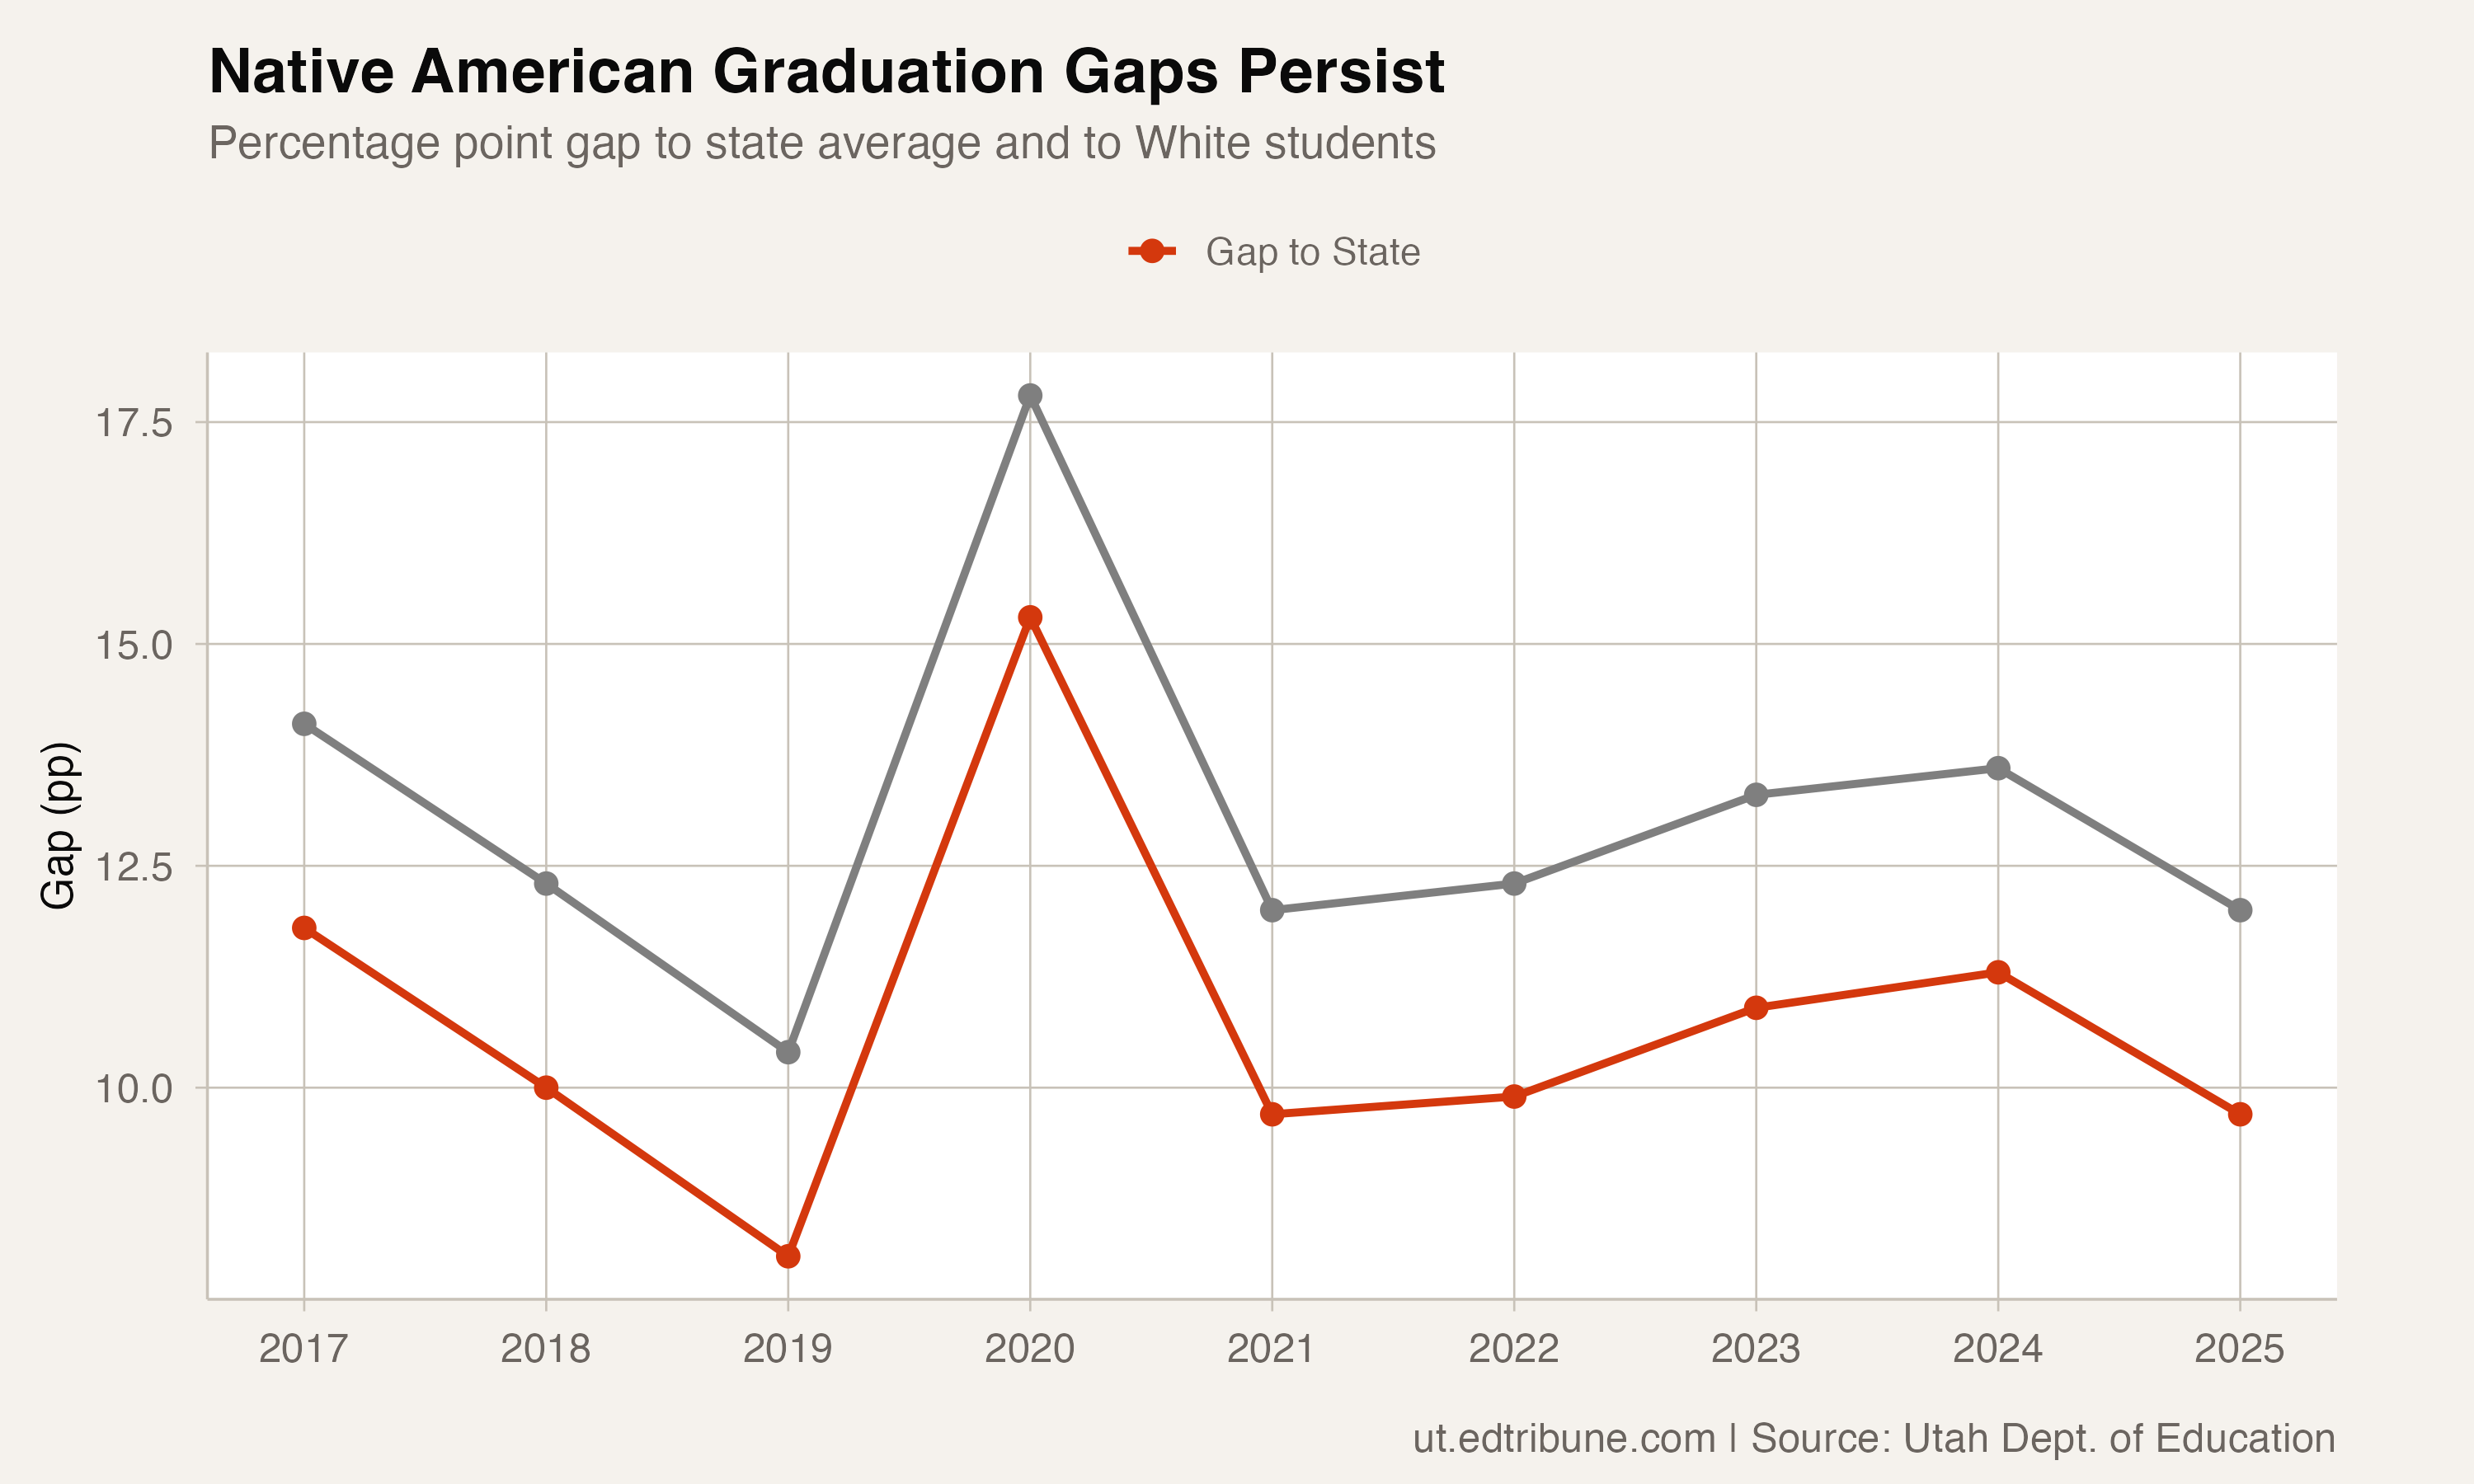
The 80.1% rate puts Native American students 9.7 points below the state average and 12 points below White students. Both gaps narrowed from their 2017 levels, but the trajectory has been uneven.

Graduation gaps persist

The gap to the state average was 12.8 points in 2017, shrank to 8.1 points in 2019, then ballooned to 15.3 points during the COVID year before slowly contracting again. In 2025, it sits at 9.7 points -- narrower than it started, but wider than it was in 2019.

The White-Native American gap follows a similar pattern: 14.1 points in 2017, a low of 10.4 in 2019, then back up to 17.8 during COVID, and 12 points in 2025.

The lesson from these trajectories is that Native American graduation rates are more fragile than other subgroups. External shocks hit harder, and recovery takes longer. The 2025 milestone of 80% comes six years after the rate first approached that level, interrupted by a crash that required half a decade to recover from.

Where Native American students attend school

Utah's Native American student population is concentrated in a handful of areas. San Juan DistrictET, which covers the Navajo Nation portion of southeastern Utah, is the primary school system for many families. Several charter and alternative schools also serve Native American communities.

San Juan's 2025 graduation rate of 90.3% suggests that not all of the gap is driven by the districts where Native American students are concentrated. State-level subgroup data doesn't reveal which districts or schools are pulling the rate down versus lifting it up. Without district-level subgroup breakdowns -- which Utah doesn't report -- it's impossible to pinpoint where the gap is widest and where targeted intervention might have the most impact.

The 20% who don't graduate

Crossing 80% means roughly one in five Native American students still doesn't graduate within four years. Some of those students may earn diplomas later, through extended programs or GED pathways. Utah doesn't publish five-year or six-year rates that would reveal how many eventually complete.

For many Native American families, the four-year timeline itself can be a barrier. Students on reservations may face long commutes, limited course offerings, family obligations that require extended absences, and cultural disconnects with a curriculum designed far from their communities. A student who takes five years to graduate because of these circumstances isn't failing -- the system is failing to accommodate their reality.

What 80.1% represents

The 80% milestone matters symbolically. It crosses a threshold that, for many policymakers, separates "crisis" territory from "challenge" territory. Below 80%, the dropout rate -- one in five or worse -- dominates the conversation. Above 80%, the conversation can shift to acceleration and gap closure.

But for the families and communities behind the number, 80.1% is thin ice. A single bad year could drop it back below the line. The volatility in the data suggests this rate hasn't been earned through the kind of steady, systemic improvement that makes it durable.

The test of whether 80% is a real milestone or a statistical moment will come in the next two to three years. If the rate holds above 80% and continues climbing, it will represent a genuine shift. If it dips back to 77% or 78%, the milestone will look more like a data point than a turning point.

Data source

Data from the Utah State Board of Education. Four-year adjusted cohort graduation rates, 2017-2025.

Detailed code that reproduces the analysis and figures in this article is available exclusively to EdTribune subscribers.

Discussion

Loading comments...