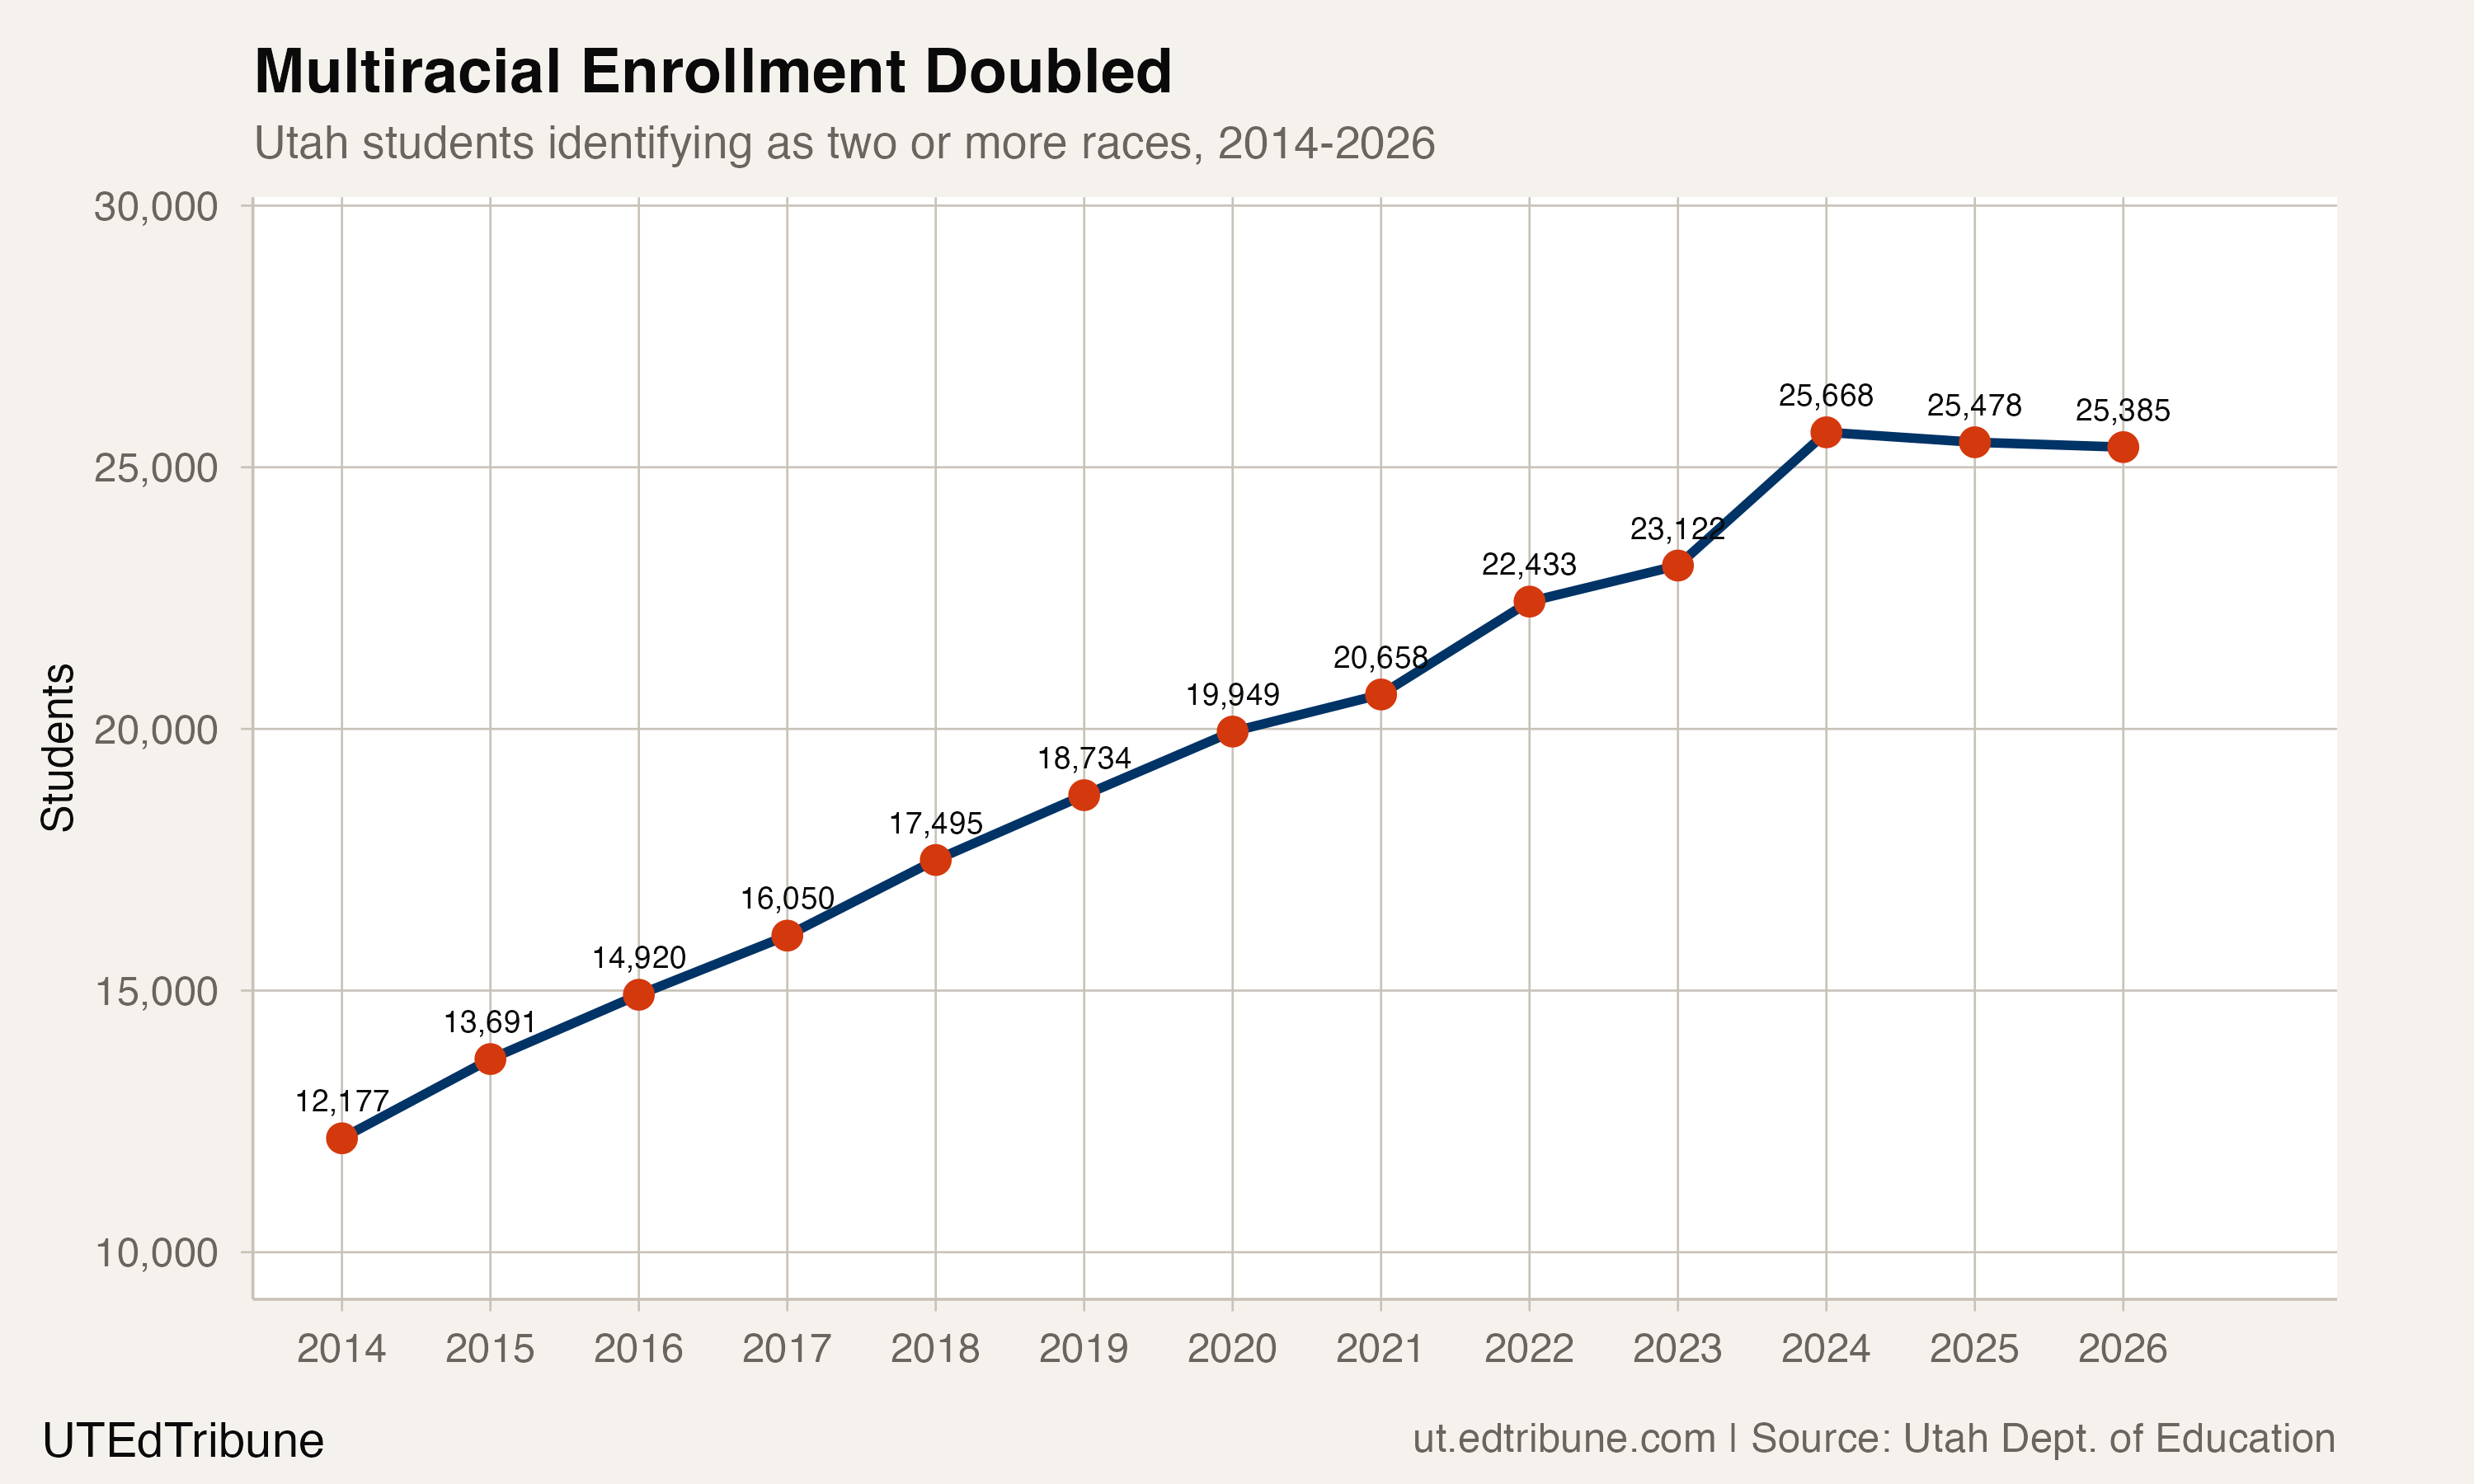
In 2014, multiracial students were a statistical footnote in Utah schools: 12,177 students, 2.0% of enrollment, clustered in suburban districts along the Wasatch Front. By 2024, that number had more than doubled to 25,668. Then it stopped.
For the first time in the 13-year dataset, multiracial enrollment declined in consecutive years, dropping by 190 in 2025 and another 93 in 2026. The 108.5% growth from 2014 to 2026 still makes multiracial students the fastest-growing racial category in Utah by a wide margin. But the abrupt stall after a decade of steady gains raises a question: was the growth reaching its natural ceiling, or was something else changing?
Third-largest and pulling away
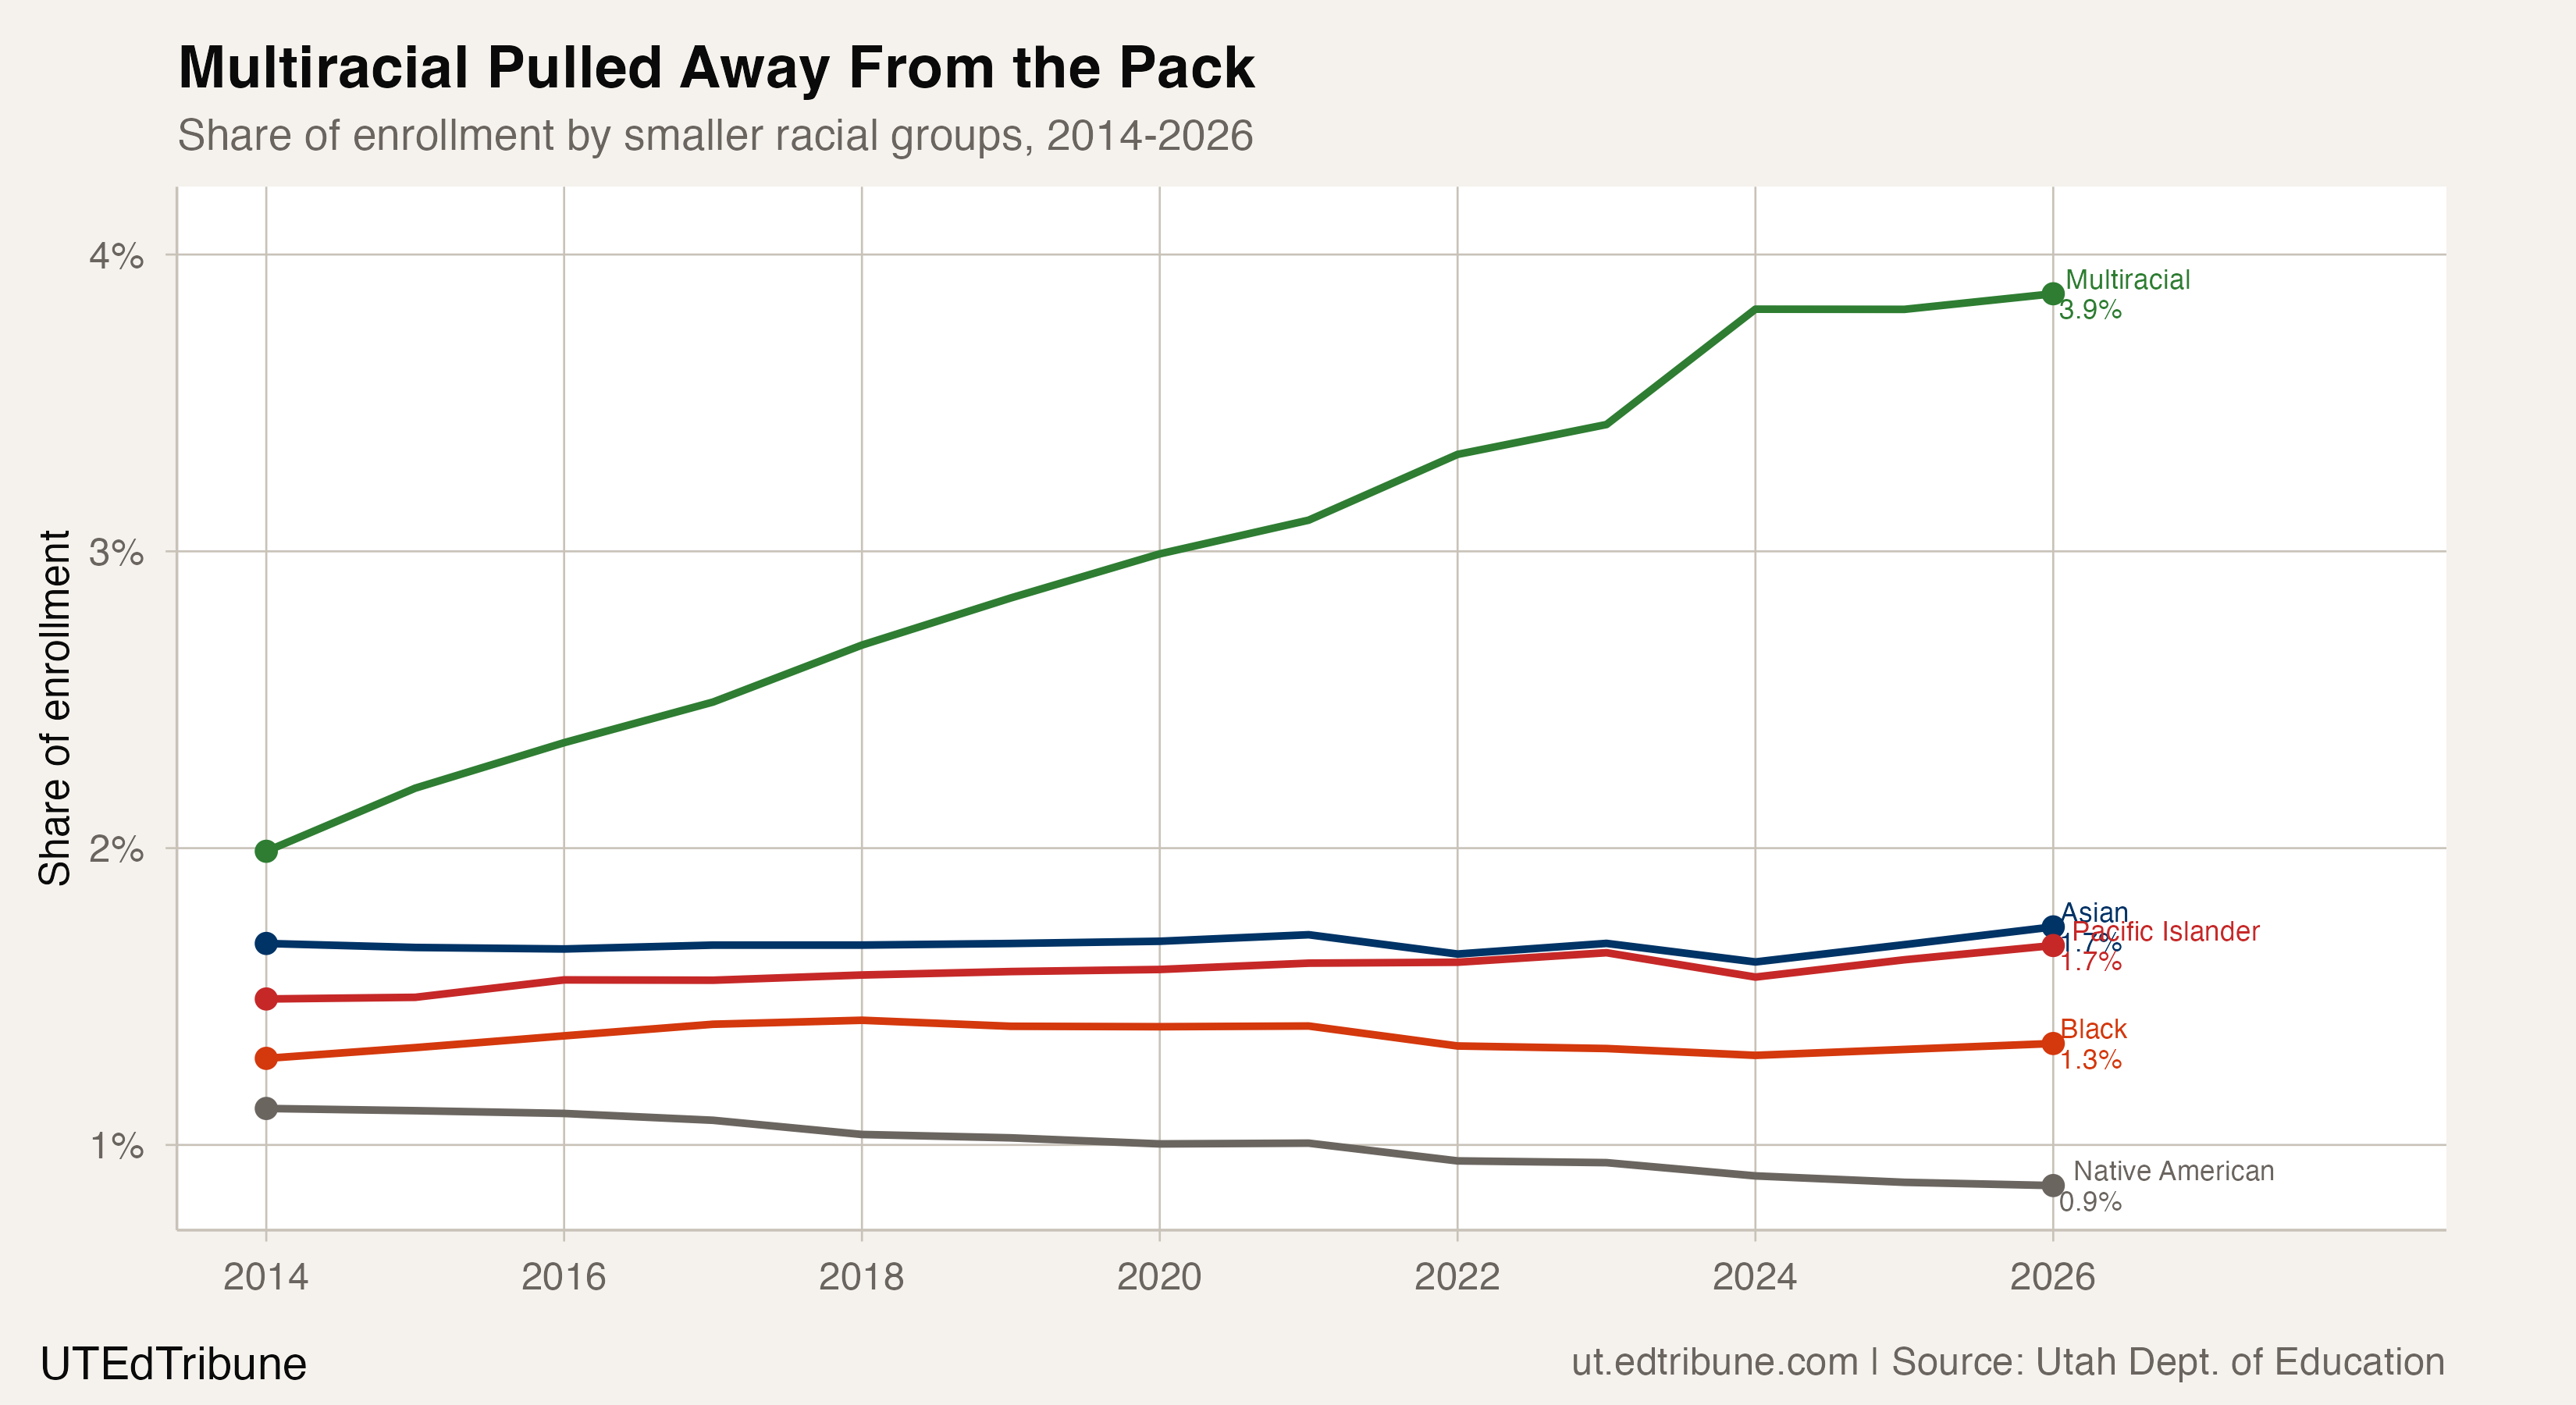
At 25,385 students and 3.9% of enrollment in 2025-26, multiracial students are now the third-largest racial group in Utah schools, behind white (68.8%) and Hispanic (21.7%). They outnumber Asian students (1.7%), Pacific Islander students (1.7%), Black students (1.3%), and Native American students (0.9%) individually.
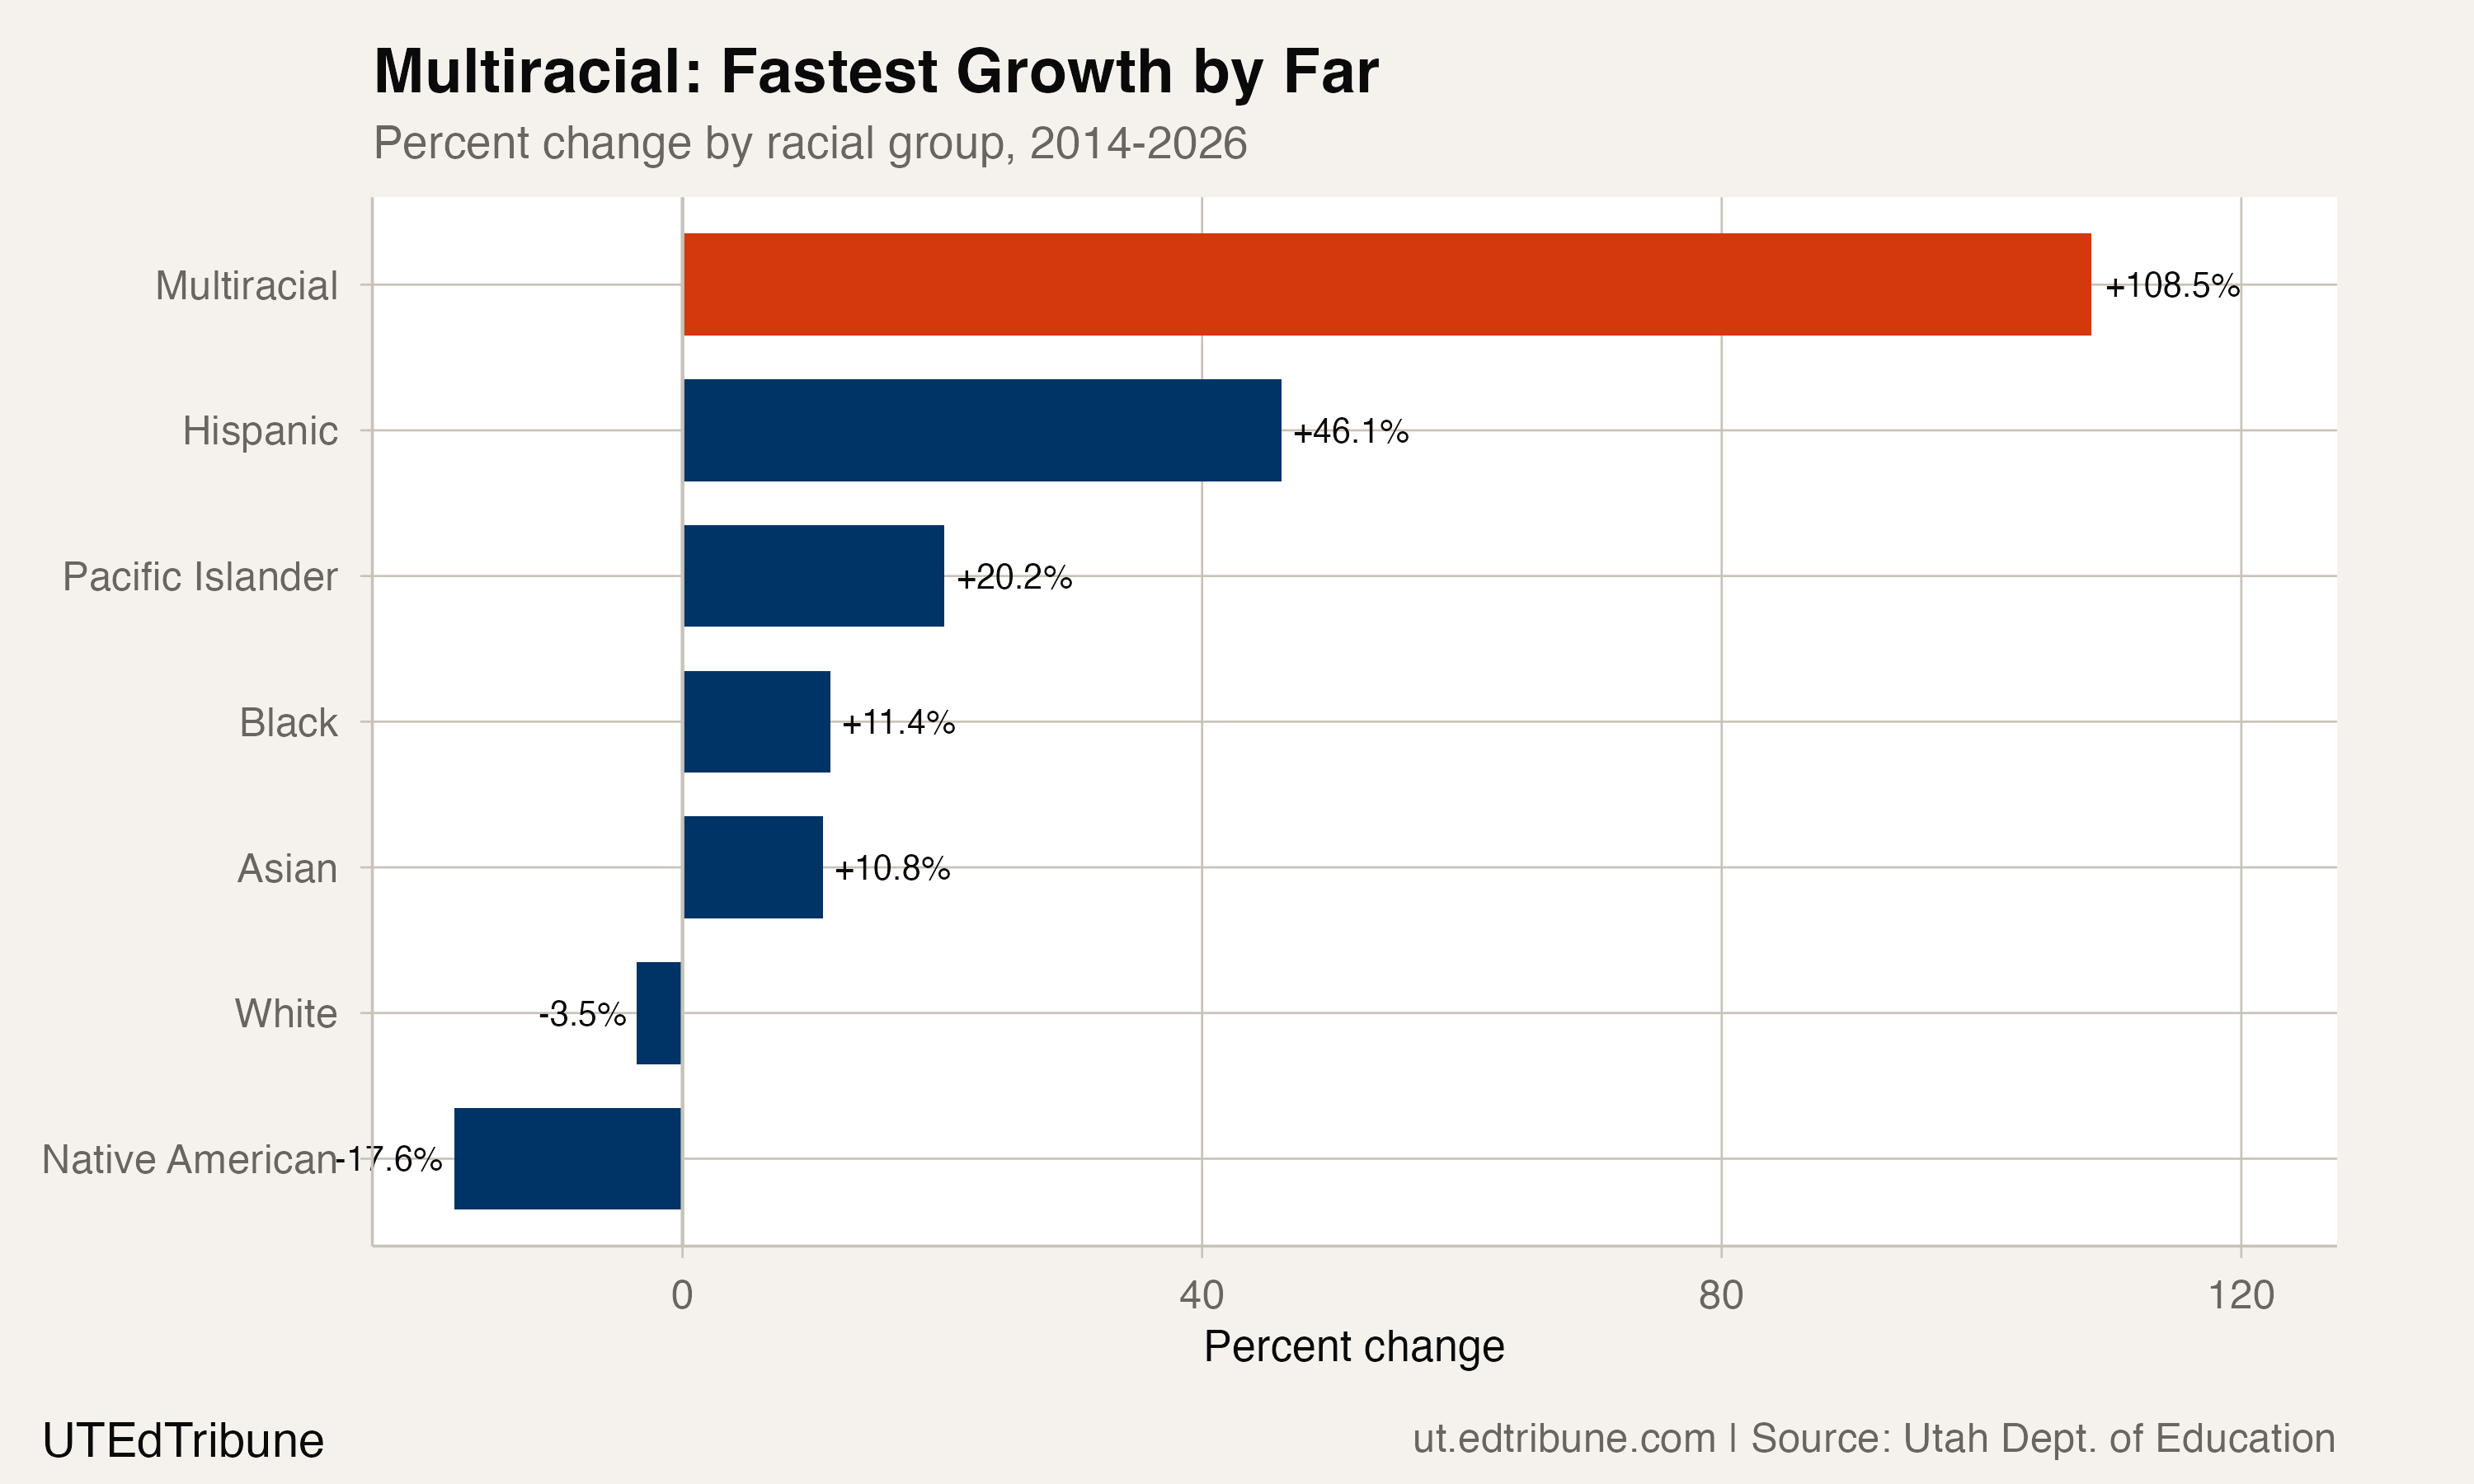
The growth rate was not close. Multiracial enrollment rose 108.5% from 2014 to 2026. The next-fastest group, Hispanic, grew 46.1%. Every other racial category grew by less than 21%, and two shrank: white enrollment fell 3.5%, and Native American enrollment declined 17.6%.
The divergence in share is equally stark. In 2014, multiracial, Asian, Pacific Islander, Black, and Native American students all occupied a narrow band between 1.1% and 2.0% of enrollment. By 2026, multiracial students had separated from that cluster entirely, reaching 3.9% while the other four groups remained between 0.9% and 1.7%.
One measure captures the scale: multiracial students (25,385) now nearly equal the combined enrollment of Asian, Black, and Native American students (25,856). A category that barely registered a decade ago now rivals three established racial groups put together.
The plateau nobody expected
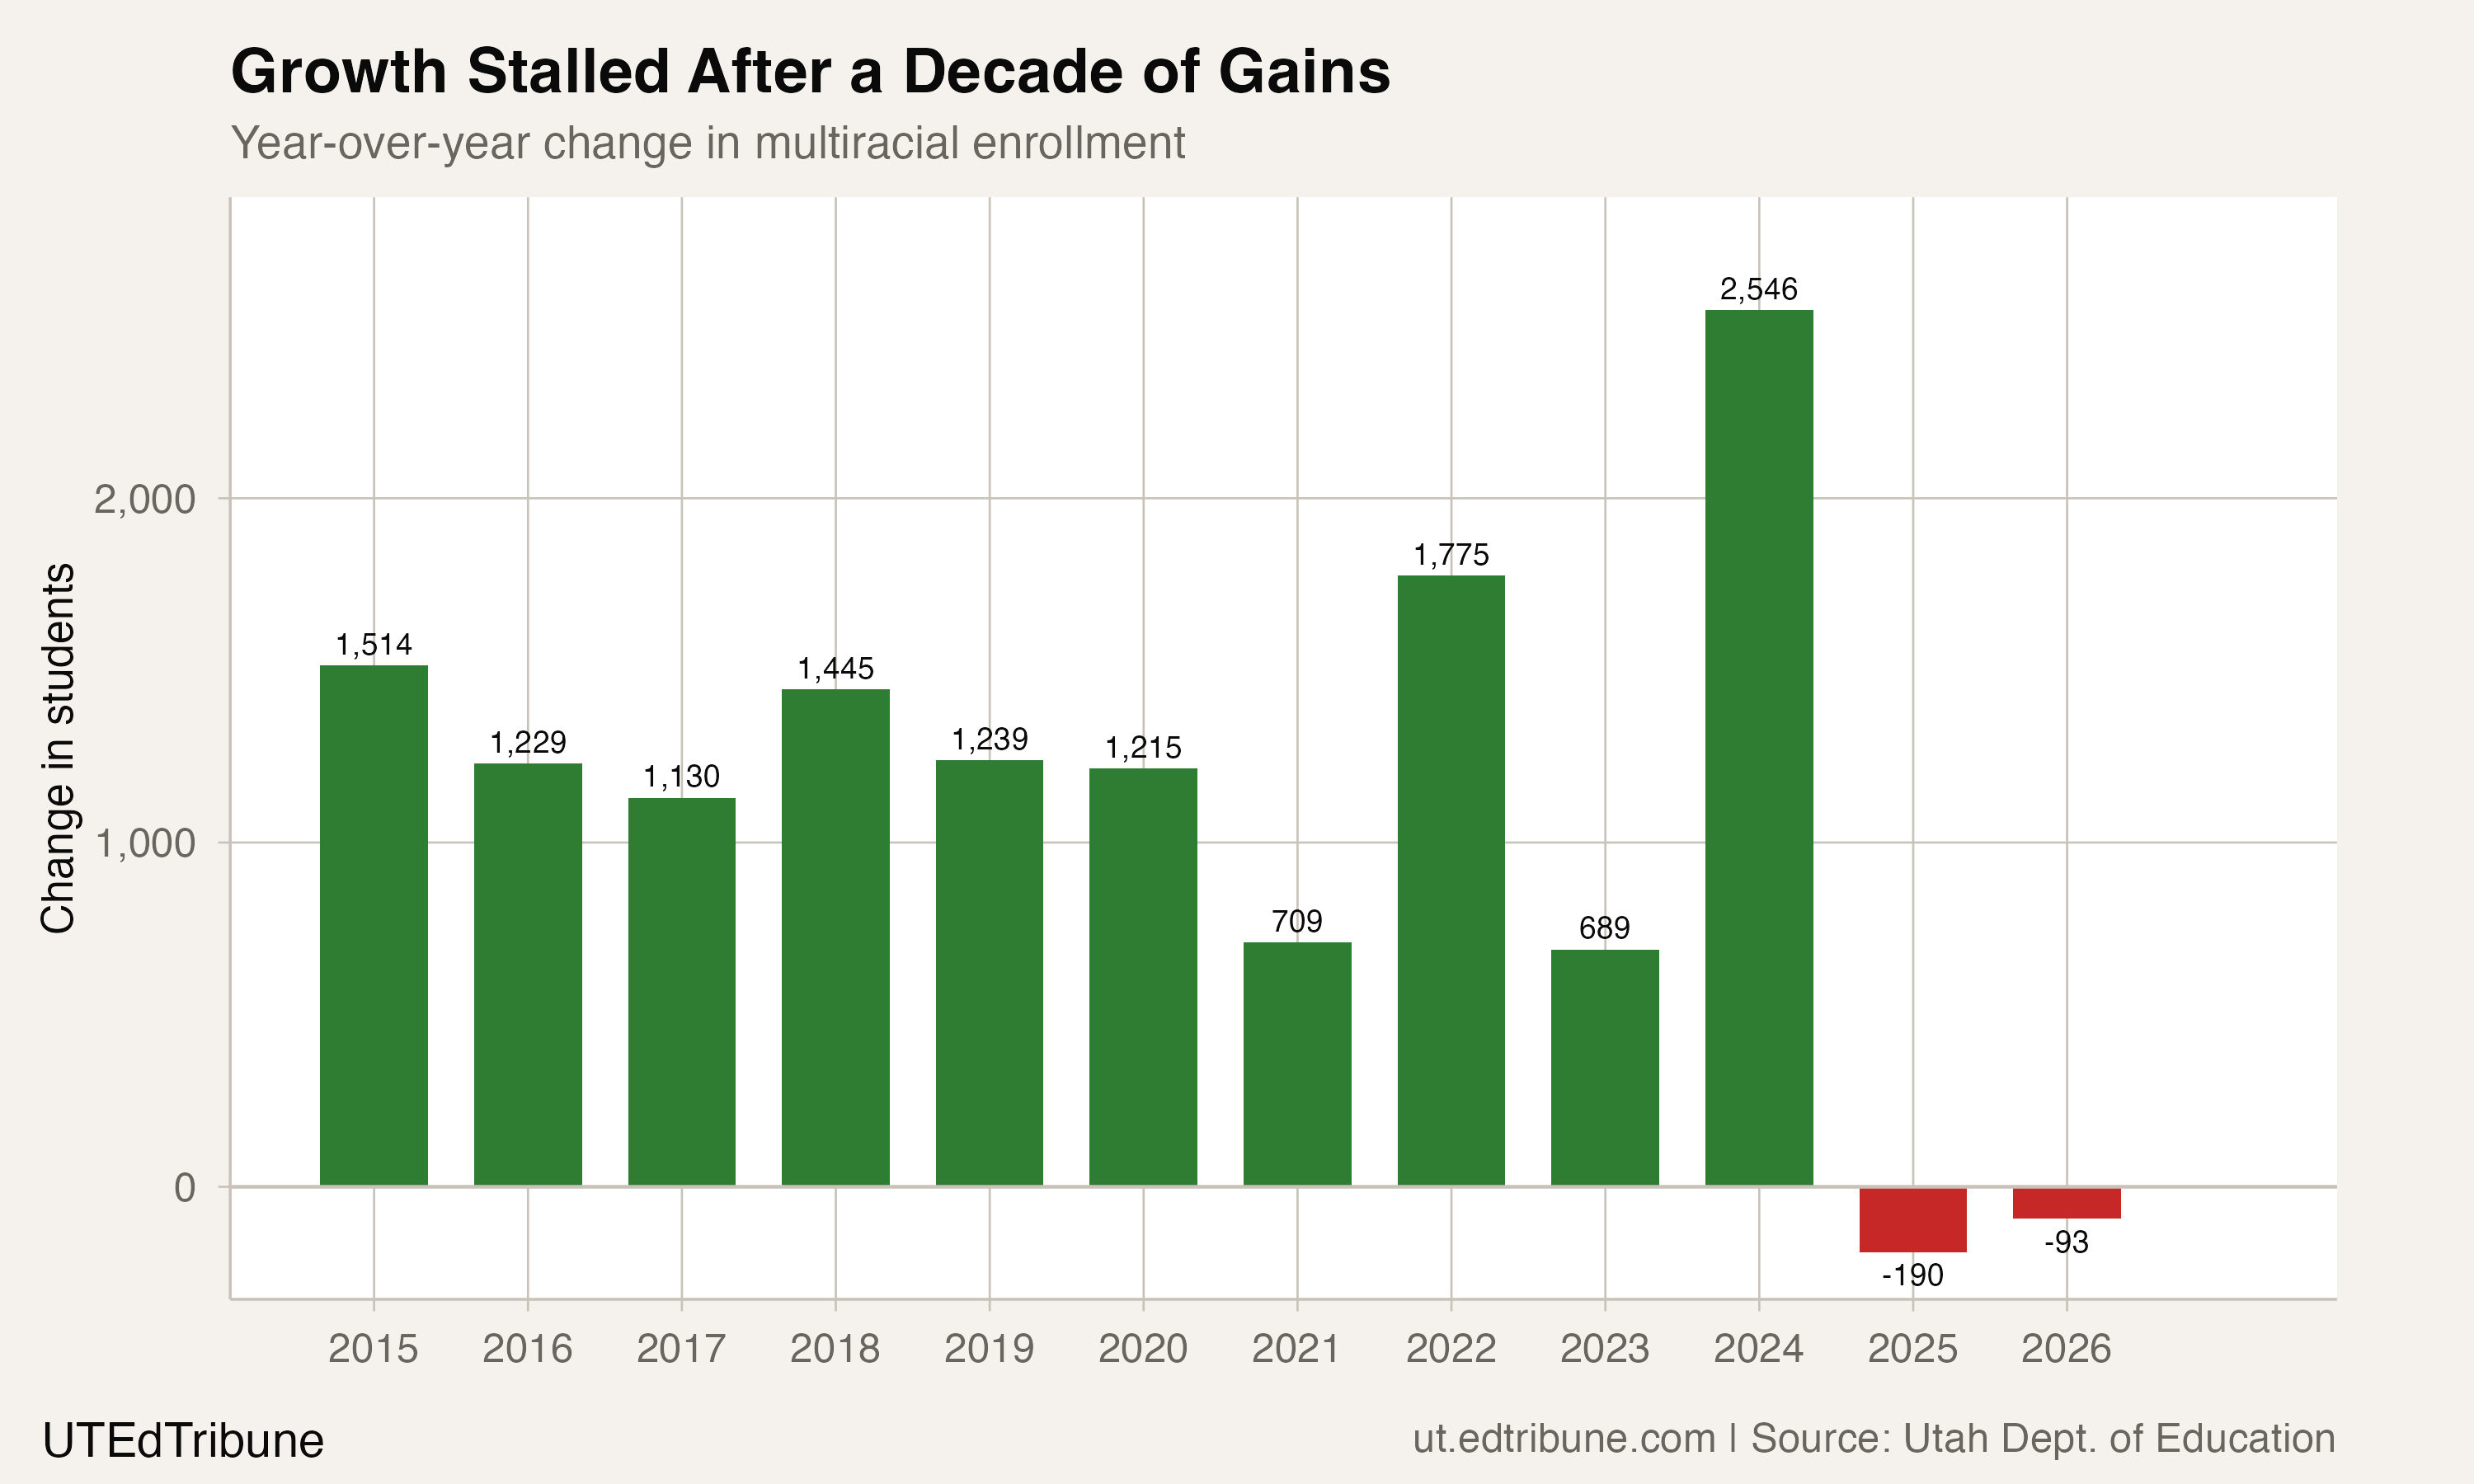
The year-over-year pattern tells a more complex story than the headline growth rate suggests. From 2015 through 2020, multiracial enrollment grew by 1,100 to 1,500 students annually, with the regularity of a metronome. COVID slowed growth to 709 in 2021, but the category bounced back with 1,775 new students in 2022. In 2024, growth surged to its highest point ever: 2,546 students in a single year, an 11.0% jump.
Then the trend reversed. Multiracial enrollment fell by 190 in 2025 and 93 in 2026, the first consecutive declines in the dataset.
The timing matters. Total Utah enrollment peaked at 674,650 in 2023 and has since fallen by 18,340. When the overall student population shrinks, every subgroup faces downward pressure. But multiracial enrollment held steady through earlier slowdowns. It grew during 2021 when total enrollment dipped. It grew through 2023 when overall growth stalled. The 2025-2026 stall arrived only after the sharpest two-year enrollment decline in the dataset.
Intermarriage, identity, and the Census Bureau's algorithm
The most intuitive explanation for multiracial growth is demographic: more interracial families are having children. Utah's interracial marriage rate now stands at roughly 19%, above the national average. That represents a significant cultural shift in a state where interracial marriage was legally prohibited until 1963.
The Kem C. Gardner Policy Institute at the University of Utah found that multiracial residents accounted for nearly 40% of the state's population growth between 2010 and 2020. That figure, however, comes with an asterisk.
Princeton researchers Paul Starr and Christina Pao published a widely cited study arguing that the 2020 Census multiracial surge was partly a "statistical illusion." The Census Bureau used an algorithm that reclassified single-race respondents as multiracial if they listed a country of origin the Bureau did not code as matching their selected race:
"Anyone who marked themselves as Black or as white on the 2020 census form but then wrote that they were of Latin American origin was reclassified by a computerized algorithm as multiracial." -- Fortune, Jan. 2025
School enrollment data uses a different collection system. Since 2010, federal reporting guidelines have required a two-question format: families first indicate Hispanic/Latino ethnicity, then select one or more racial categories. The school-level multiracial growth in Utah has been far steadier than the Census jump, adding 1,000 to 1,500 students most years rather than tripling overnight. That pattern is more consistent with a genuine generational shift in how families identify their children than with a one-time methodological reclassification.
The Gardner Institute also found that over half of multiracial Utahns identify as Hispanic or Latino, which suggests the growth is closely intertwined with the state's broader Hispanic population increase of 44,896 students (46.1%) over the same period.
Where the growth concentrates
The largest traditional districts drive most of the multiracial count. Alpine District leads with 3,836 multiracial students in 2026, followed by Jordan (2,733), Davis (2,360), and Canyons (1,919). These suburban Wasatch Front districts collectively account for half of all multiracial enrollment in traditional districts.
Granite District stands out for velocity. Its multiracial enrollment rose from 777 in 2019 to 1,676 in 2026, a 115.7% increase in seven years, faster than the statewide pace over a comparable period.
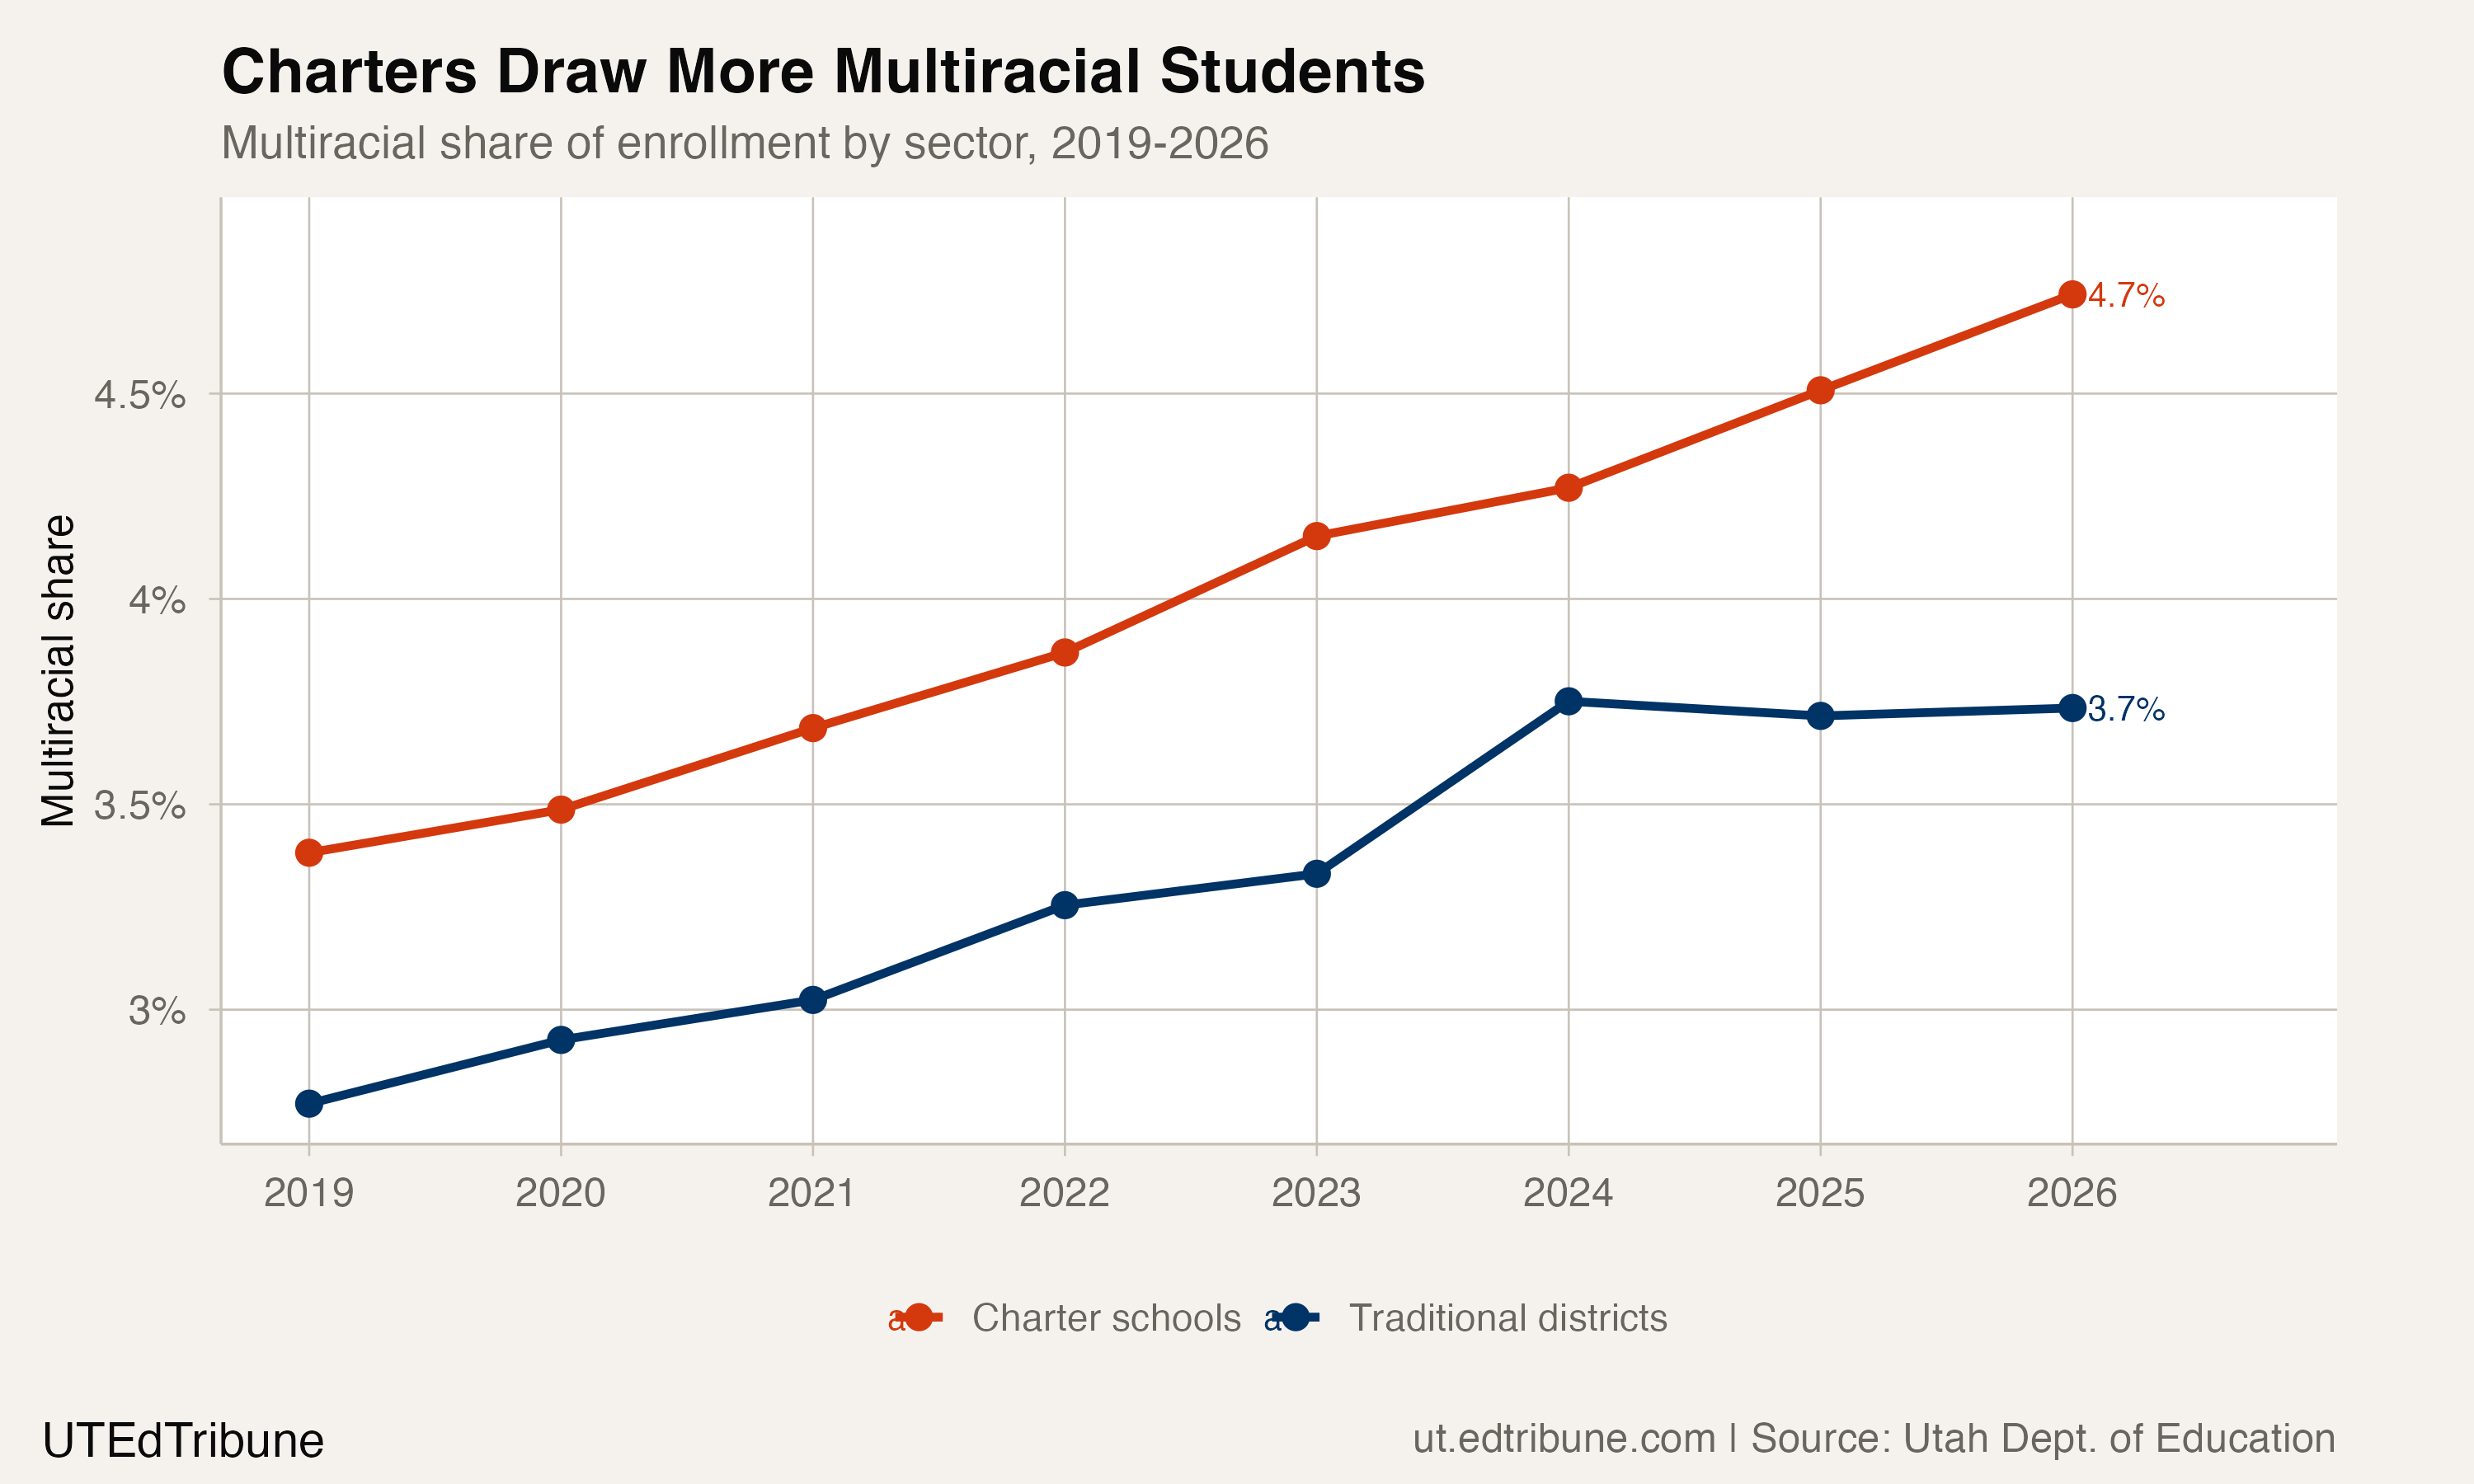
Charter schools enroll a disproportionate share of multiracial students. In 2026, 4.7% of charter enrollment was multiracial, compared to 3.7% in traditional districts. That gap has widened every year since 2019, when charters were at 3.4% and traditional districts at 2.8%.
The charter-traditional split also explains part of the recent plateau. Traditional district multiracial enrollment fell by 917 students between 2024 and 2026, while charter multiracial enrollment grew by 634 over the same period. The net result was a statewide decline of 283. Charter schools are still adding multiracial students; traditional districts are losing them.
The question behind the numbers
Pamela Perlich, the University of Utah's senior research economist, described the broader diversification trend as "stunning" and "absolutely irreversible." The enrollment data supports her characterization. White enrollment share has fallen 7.7 percentage points since 2014, from 76.5% to 68.8%. Multiracial growth alone accounts for 1.9 of those lost percentage points.
But the 2025-2026 stall complicates the trajectory. One possibility is demographic: the multiracial category is approaching its natural share given current intermarriage rates and birth cohort sizes. Utah's total fertility rate has been flat or declining for 15 consecutive years, falling to 1.8 births per woman in 2023 and dropping from the nation's highest to 10th, which means fewer children overall, including fewer multiracial children. Another possibility is that the stall reflects the broader enrollment decline pulling all categories down, and multiracial growth will resume if total enrollment stabilizes.
Twelve years ago, one in 50 Utah students identified as multiracial. By 2025-26, it was one in 26. That shift happened without a single press release, board resolution, or public hearing. It happened in the way families filled out forms, in the way children see themselves, and in the widening gap between the Census Bureau's categories and the lives of the students sitting in Utah's classrooms.
Detailed code that reproduces the analysis and figures in this article is available exclusively to EdTribune subscribers.
Discussion
Sign in to join the discussion.
Loading comments...