In January 2025, attendance at the Salt Lake City School District dropped four percentage points in a single month. District spokesperson Yándary Chatwin told The Salt Lake Tribune that the timing coincided with a federal policy change allowing immigration enforcement on school campuses for the first time in over a decade. The district rushed to reassure families: it does not collect immigration status, and it would not become "a source of sharing anything about their family."
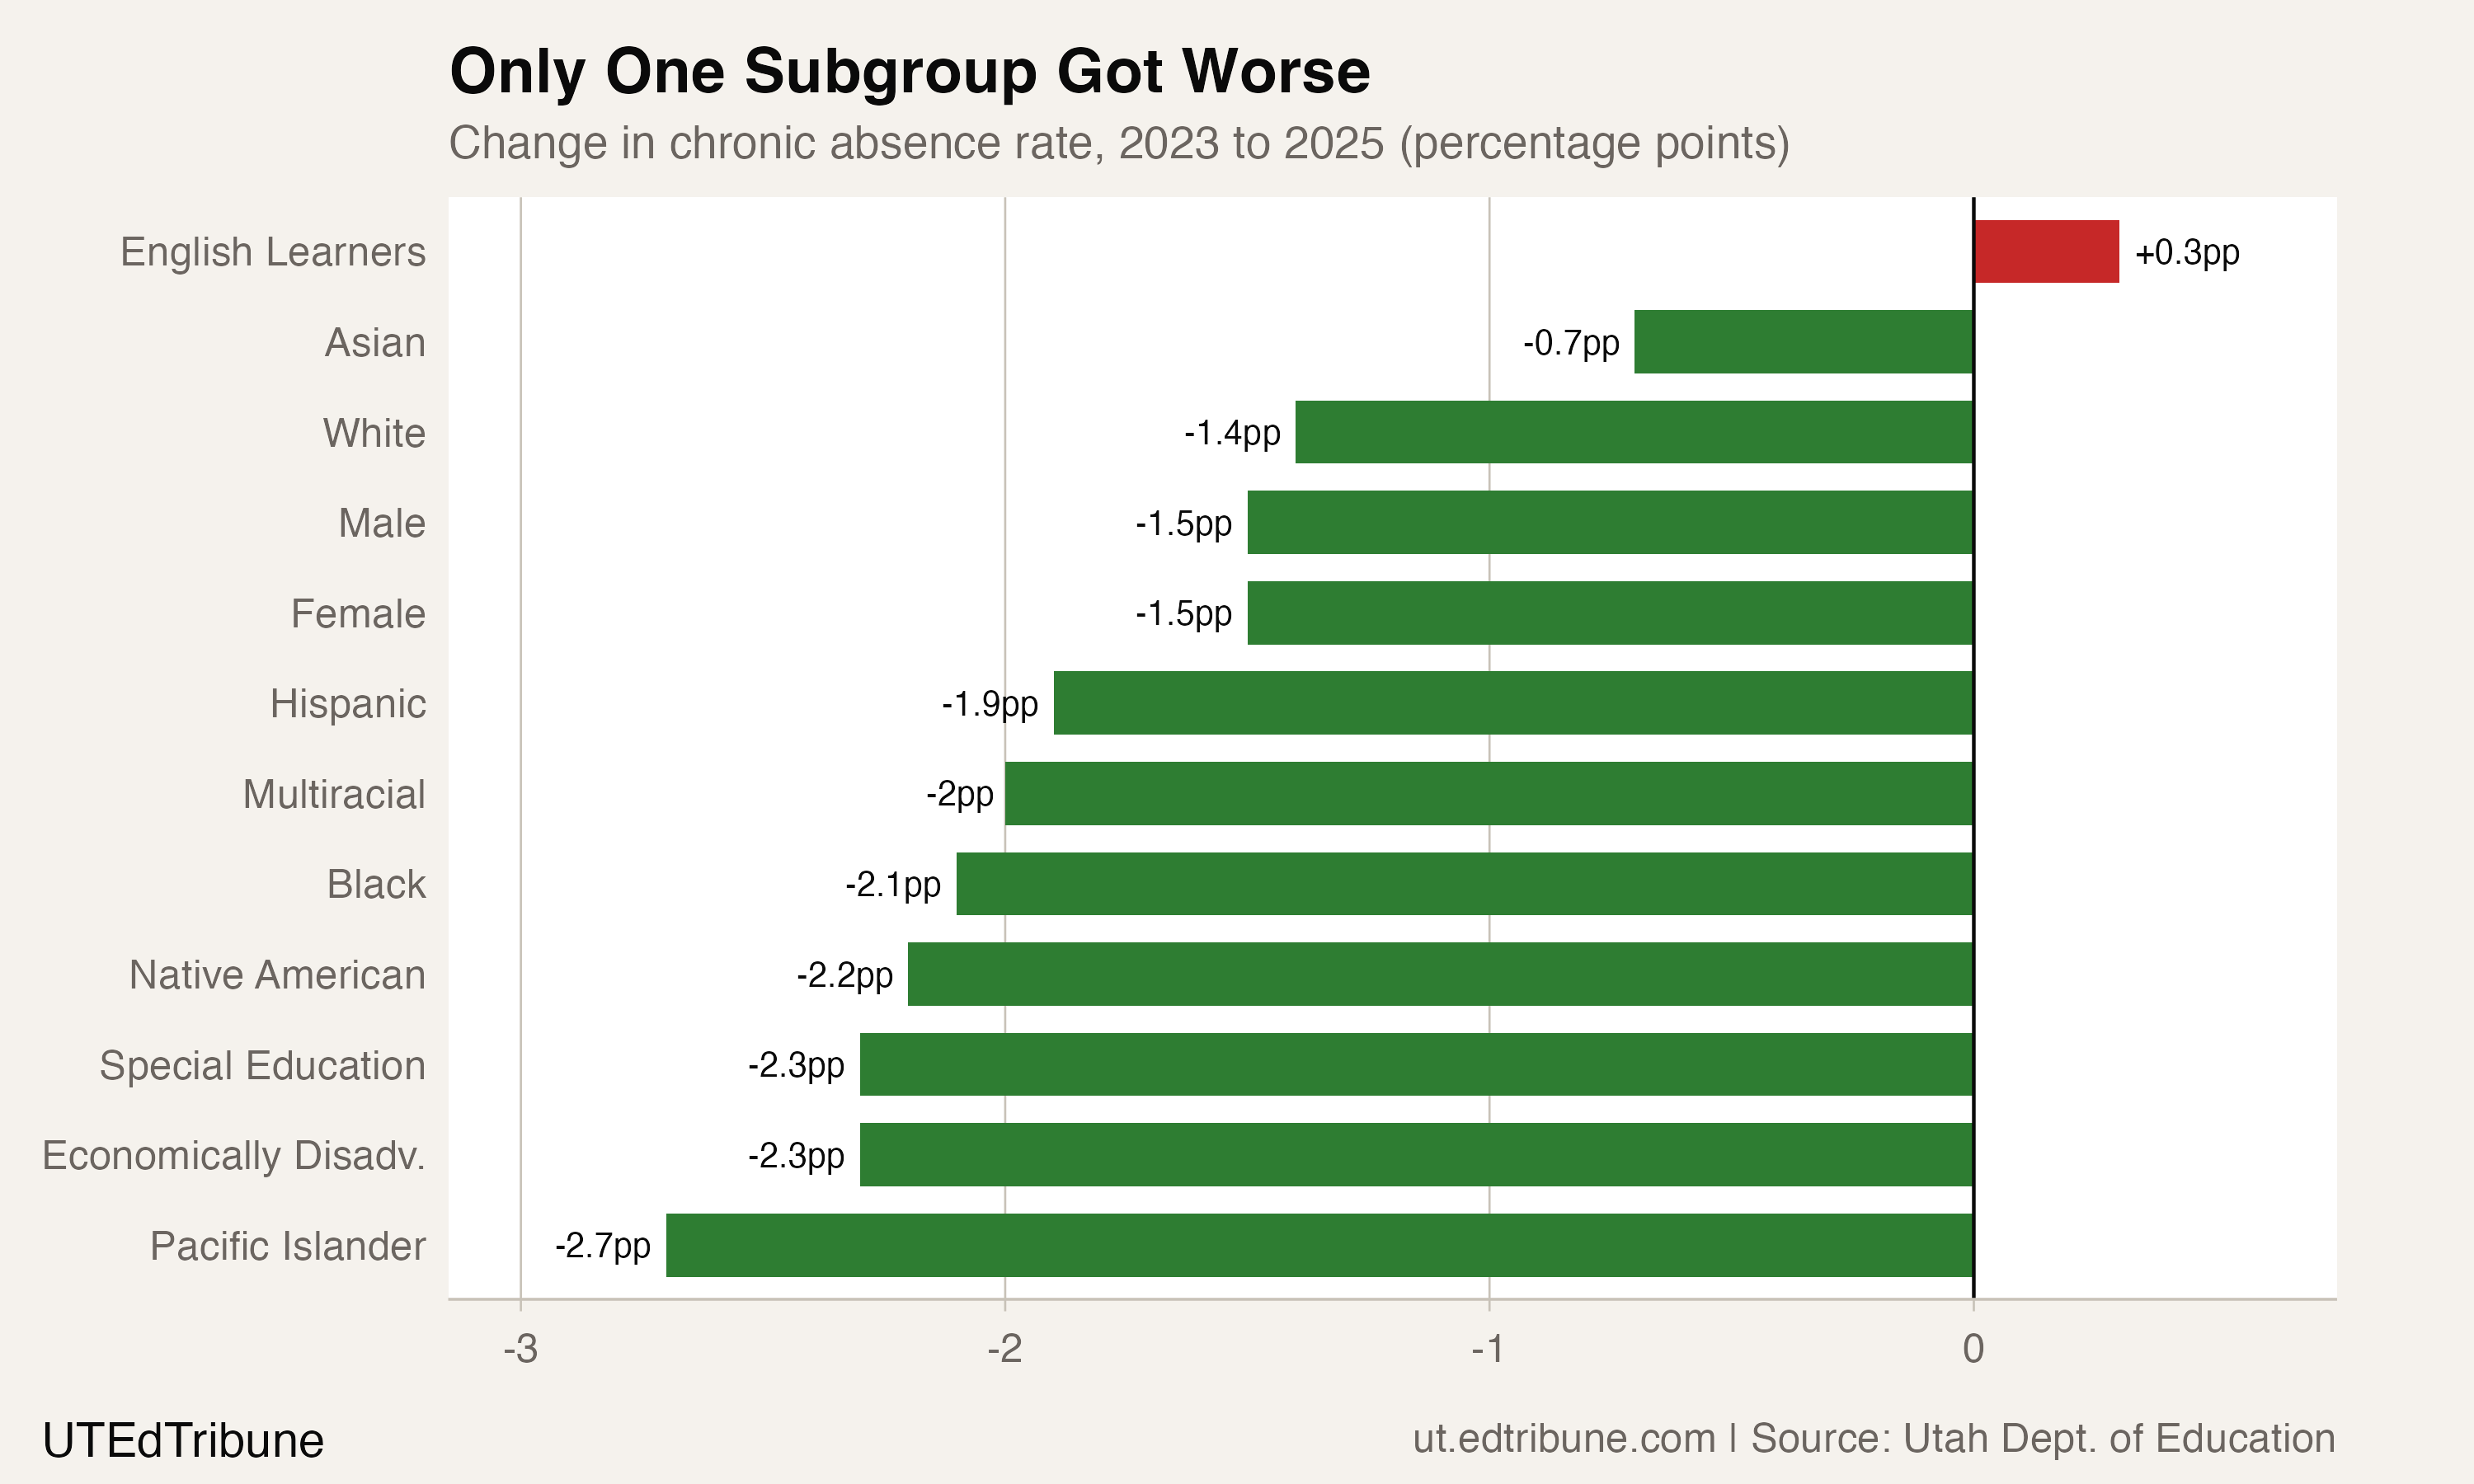
That month captured, in miniature, a problem Utah's statewide data now confirms across two full school years. Between 2022-23 and 2024-25, every major student group in Utah reduced its chronic absence rate. Pacific Islander students improved by 2.7 percentage points. Economically disadvantaged students improved by 2.3 points. Special education, Native American, Black, Hispanic, multiracial, male, female, white, Asian: all improved. The state average fell from 25.2% to 23.8%.
English learners moved in the opposite direction. Their chronic absence rate rose from 35.9% to 36.2%, making them the only subgroup in Utah's data where the problem got worse.
The gap that keeps widening
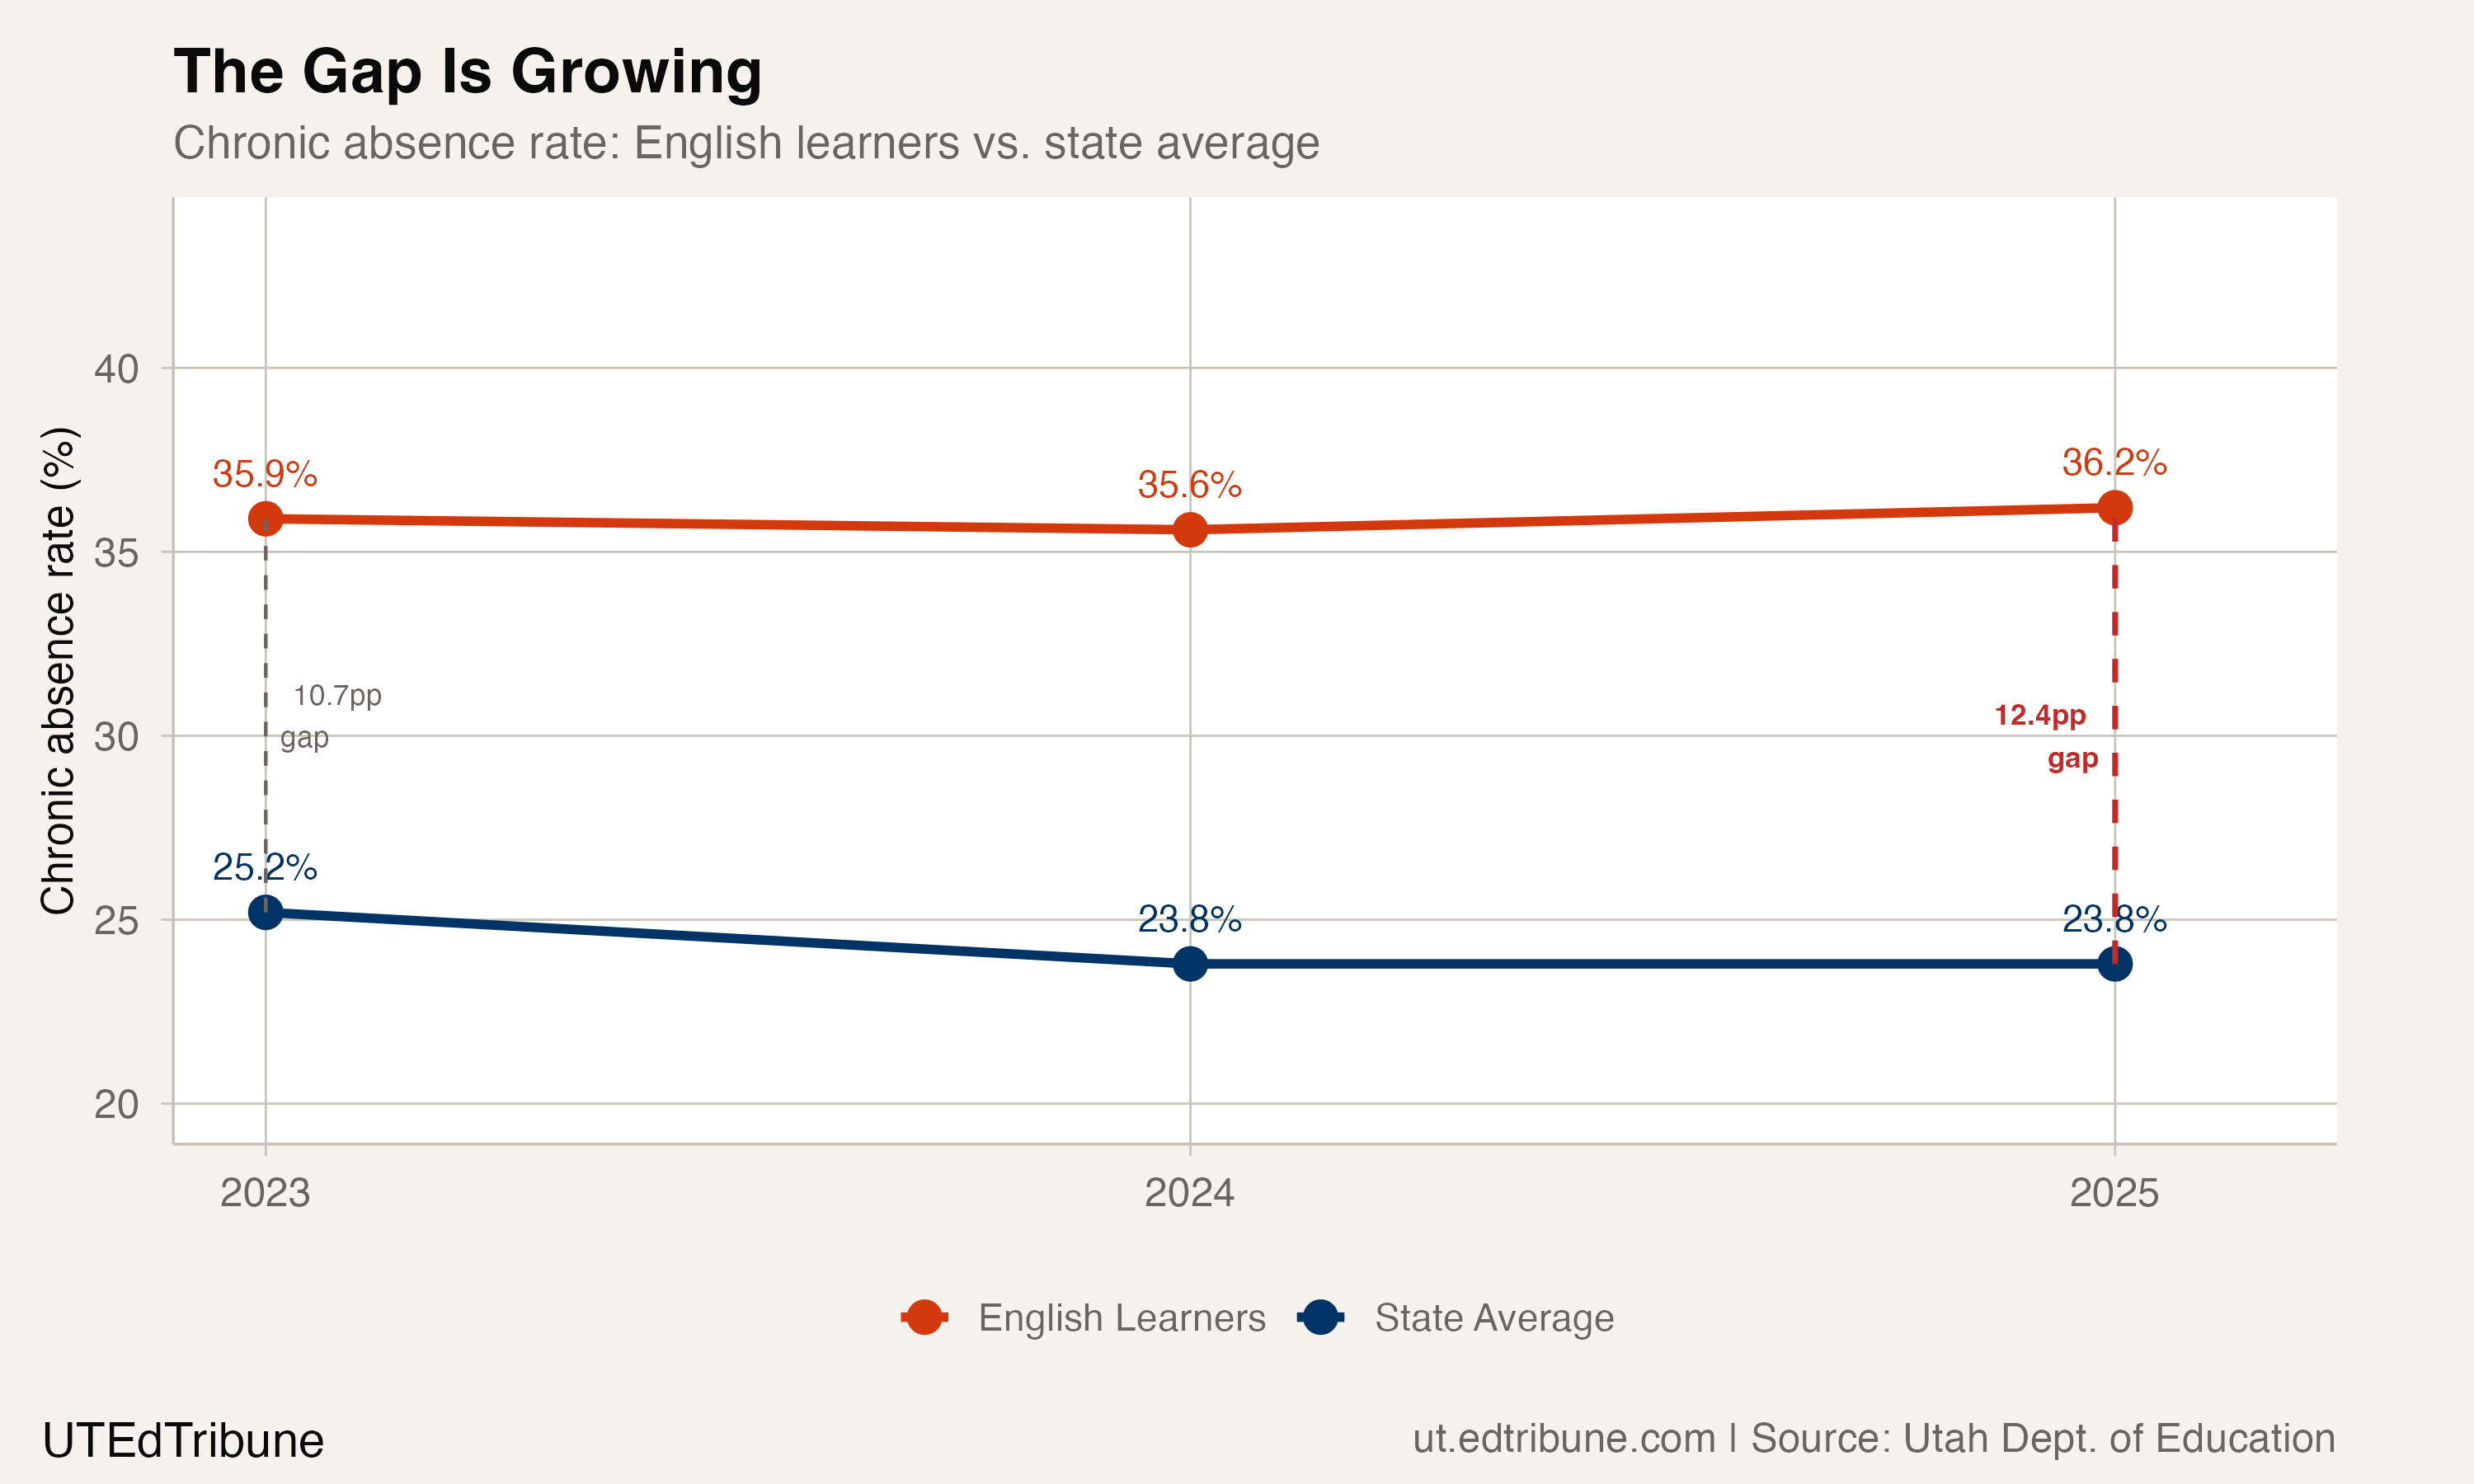
The raw increase of 0.3 percentage points understates the problem. Because everyone else improved while English learners did not, the gap between EL students and the state average grew from 10.7 points in 2022-23 to 12.4 points in 2024-25, a widening of 1.7 percentage points in two years.
The year-by-year pattern shows the divergence accelerating. In 2023-24, the EL rate dipped slightly to 35.6% while the state average dropped to 23.8%, opening the gap to 11.8 points. In 2024-25, the state average held at 23.8% while EL students reversed course, climbing back to 36.2%.
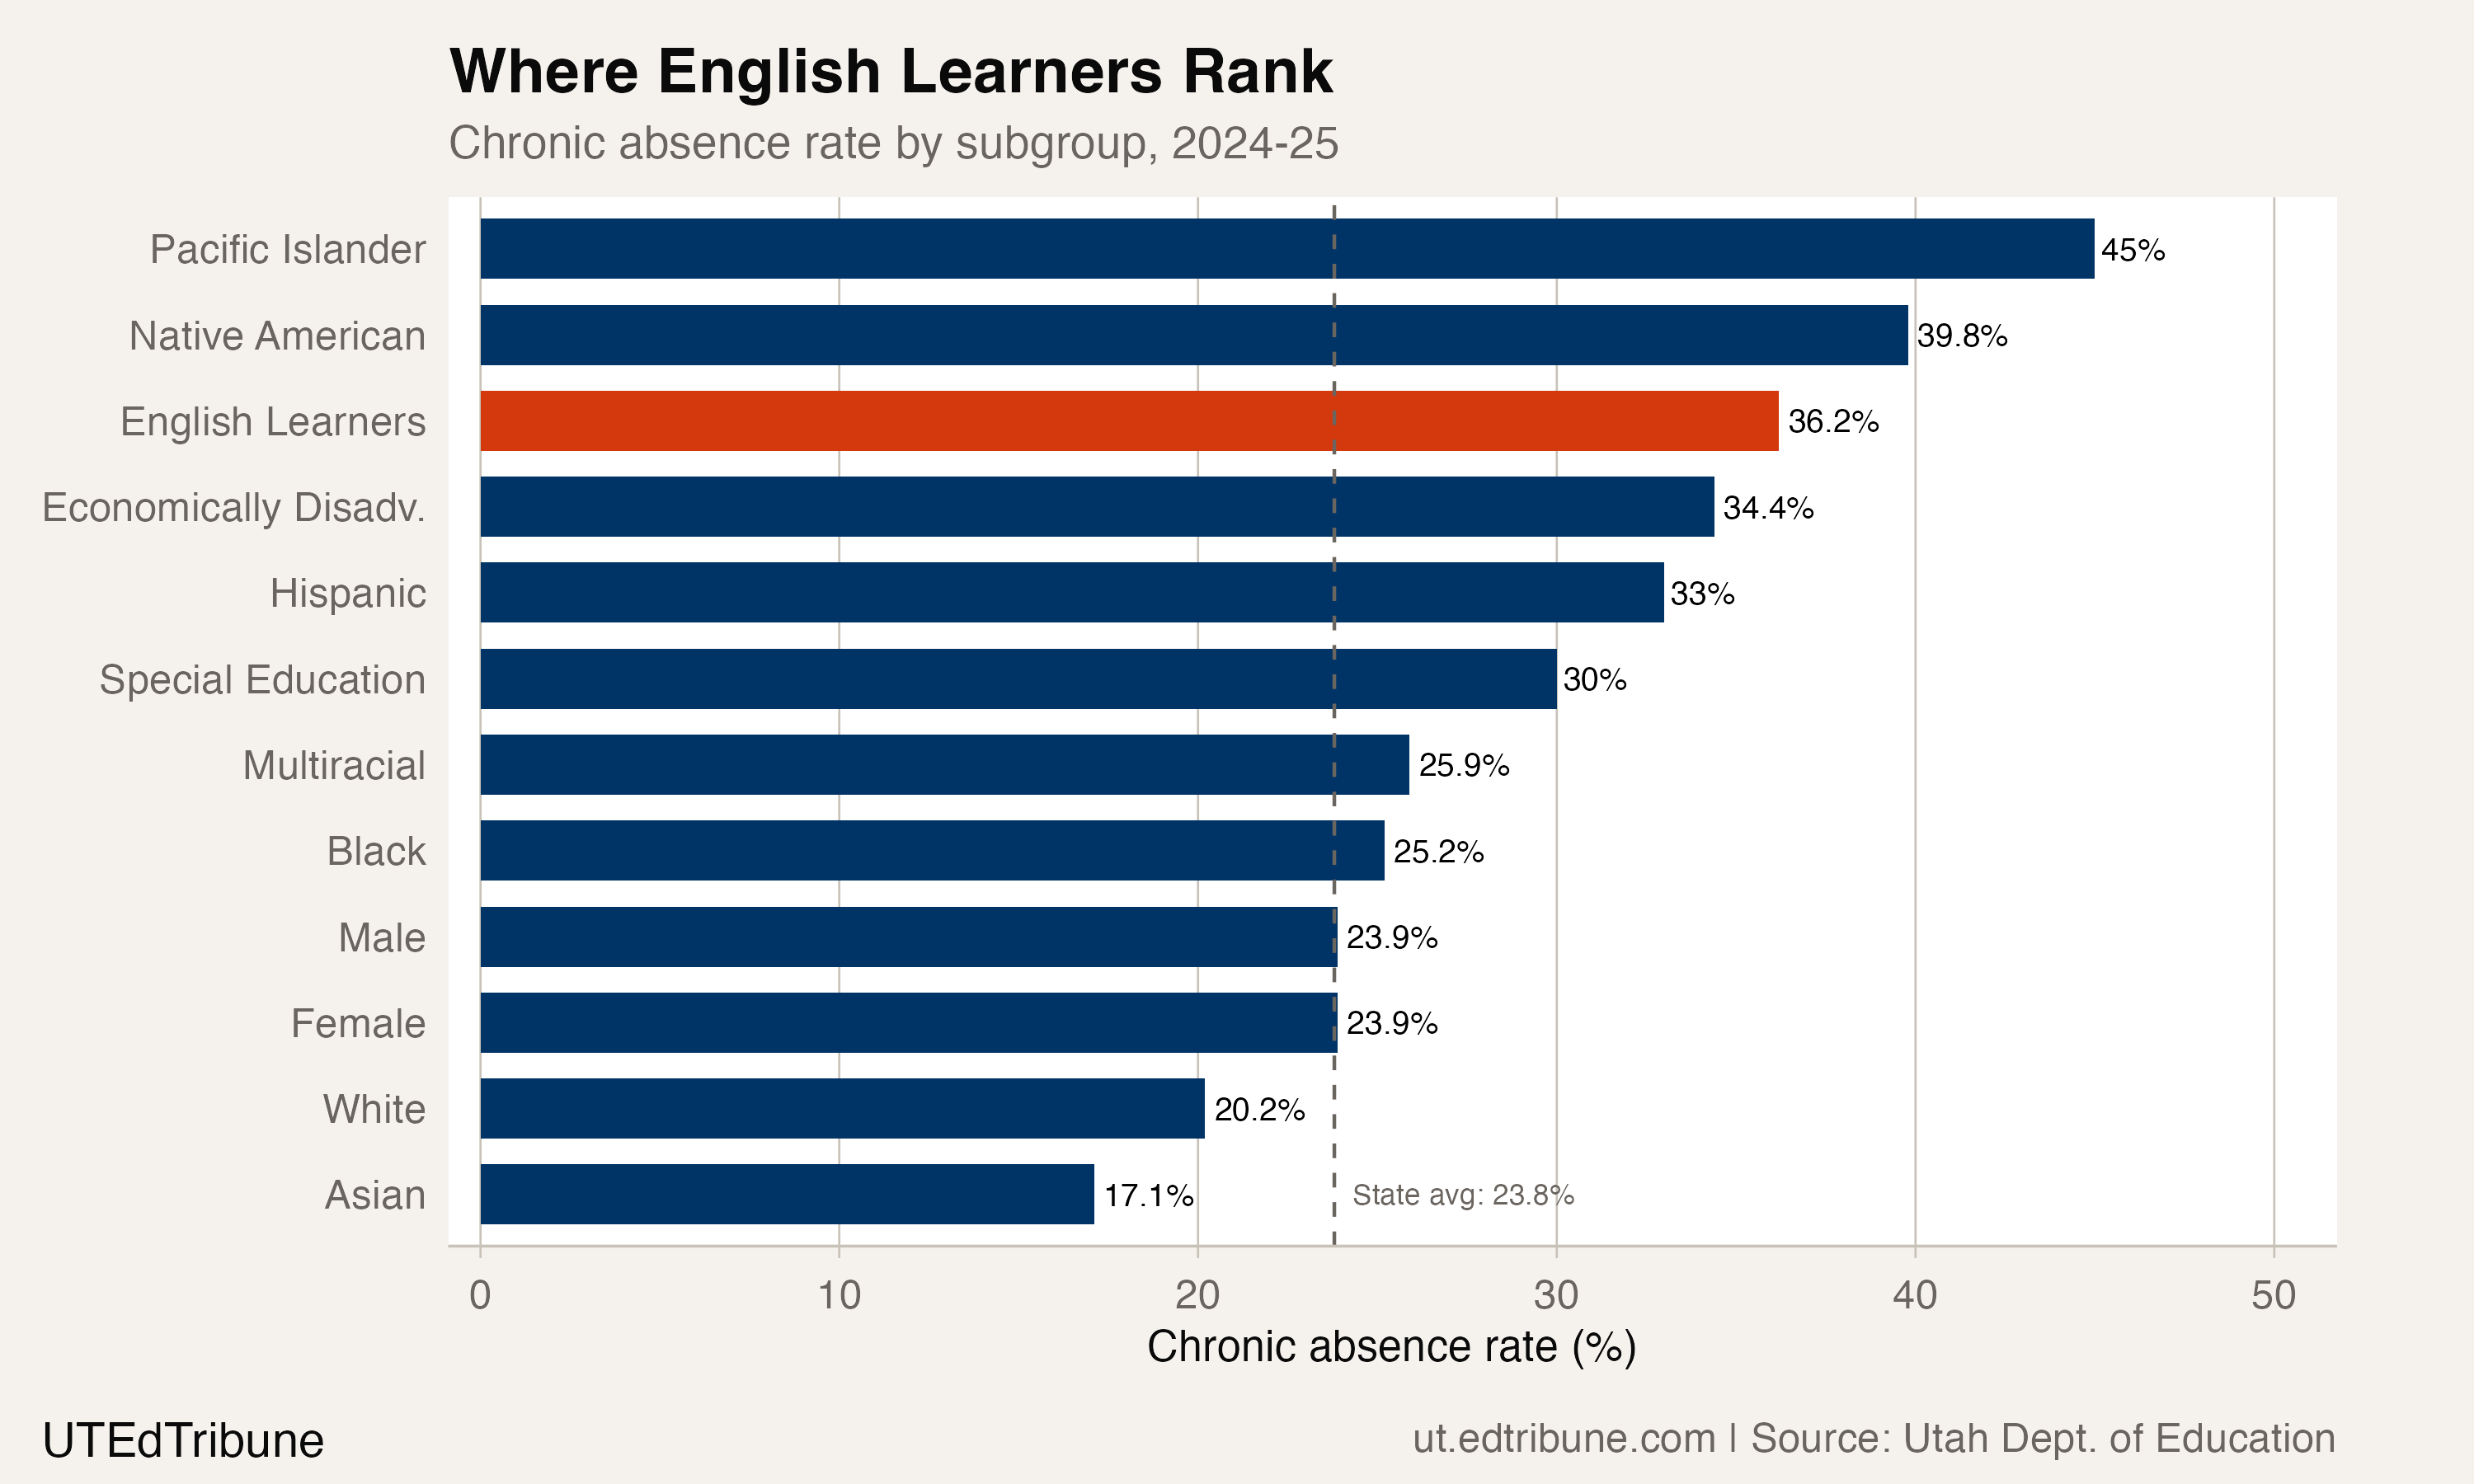
More than one in three English learners in Utah is now chronically absent, missing 10% or more of the school year. That places EL students third among all subgroups in chronic absence rate, behind only Pacific Islander students (45.0%) and Native American students (39.8%), and ahead of economically disadvantaged students (34.4%).
Note that English learners and racial/ethnic groups overlap substantially: many EL students are also Hispanic, and the categories should not be read as mutually exclusive population counts.
Where the pressure concentrates
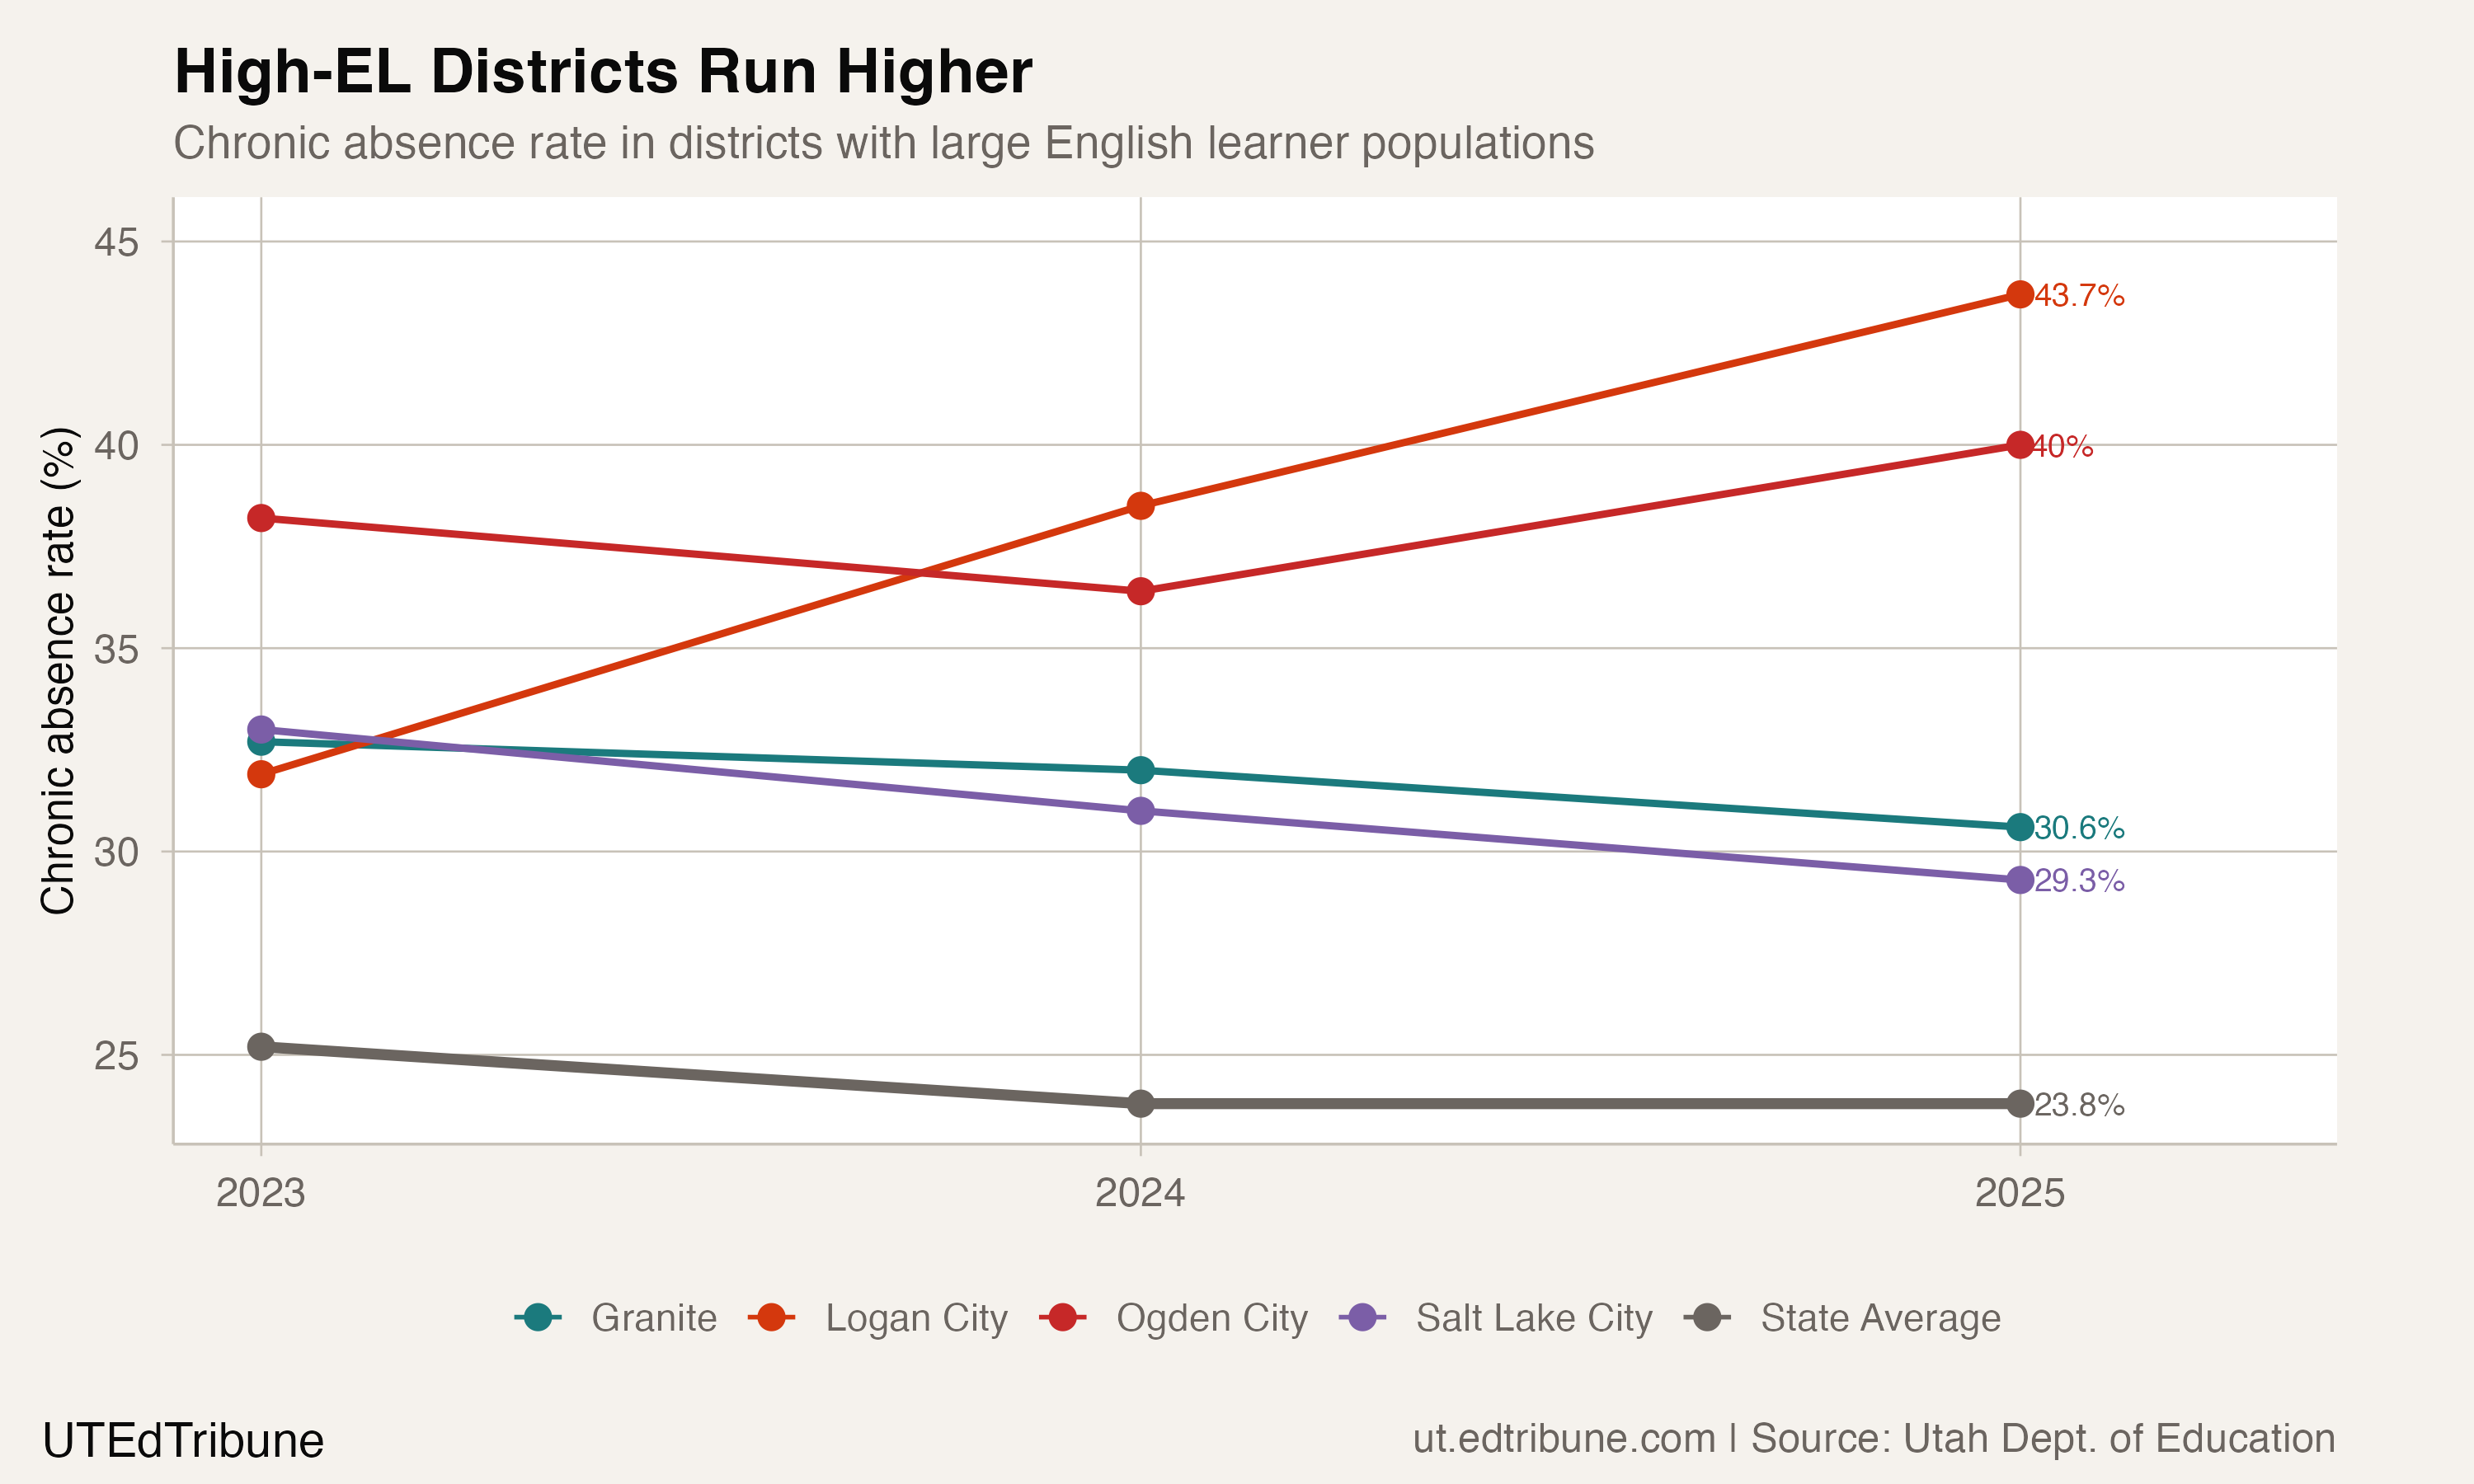
Utah's demographic subgroup data exists only at the state level, so the data cannot show which districts drive the EL chronic absence rate. But the districts with the largest English learner populations offer a rough proxy. Their overall chronic absence rates, which reflect all students and not just EL students specifically, run well above the state average and are diverging further.
Logan City↗ET stands out. Its overall chronic absence rate climbed from 31.9% in 2022-23 to 43.7% in 2024-25, an increase of 11.8 percentage points. That puts nearly half the district's students in the chronically absent category. Logan is home to a significant refugee and immigrant community, much of it connected to resettlement agencies including the Cache Refugee and Immigrant Connection, which partners with Lifting Hands International to resettle families in the area.
Ogden City↗ET, another district with a large EL population, saw its rate climb from 38.2% to 40.0% between 2022-23 and 2024-25. After a brief improvement in 2023-24 (36.4%), the rate spiked back.
The picture is not uniform. Salt Lake District↗ET moved in the opposite direction, dropping from 33.0% to 29.3%. Granite District↗ET also improved, from 32.7% to 30.6%. Both serve substantial EL populations. Whatever is driving the statewide EL gap, it is not simply a function of being a high-EL district.
Fear as an attendance barrier
The most direct explanation for the widening EL attendance gap is the simplest: some families are keeping children home because they are afraid.
The federal government rescinded its longstanding policy designating schools as "sensitive locations" off-limits to immigration enforcement in January 2025. Utah's immigrant communities felt the shift immediately.
"The kids are not coming. Simple as that. People are afraid of going places where they could potentially be picked up." -- Sen. Luz Escamilla (D-Salt Lake City), The Salt Lake Tribune, Feb. 2025
The Salt Lake City School District reported that middle and high schools saw the largest attendance decline: 1,056 fewer students in the week the policy change was announced compared to the previous week. The Granite School District↗ET also confirmed attendance declines and said it was working to "assuage fears from families and assure them," according to spokesperson Andrea Stringham.
In January 2026, students at multiple high schools across Salt Lake County walked out to protest federal immigration enforcement, an indication that the issue remains live in school communities more than a year after the policy change.
A national pattern with a Utah accent
Utah is not the only state where EL chronic absence has stalled while other groups recover. A FutureEd and The 74 analysis of 27 states found that before the pandemic, English learner absenteeism was at or below the statewide average in 14 states. By 2024-25, that was true for only six. Utah was flagged as one of six states where EL absenteeism remains "more than 15 points above pre-pandemic levels," compared with a 9.5-point statewide gap. The national average EL gap was 11 points above pre-pandemic rates; Utah's is worse.
The question this data cannot answer is whether the statewide EL increase reflects more students arriving with attendance barriers, or more existing students being kept home. Immigration enforcement is one plausible driver. But reclassification also plays a role: students who improve their English proficiency exit EL status, which can leave the remaining EL population weighted toward newer arrivals who face greater barriers. This is a structural feature of how EL status works, not evidence against an enforcement effect, but it means the rate can worsen even without a single new absence.
A funding system that notices
Utah's school funding runs on Average Daily Membership, meaning chronic absence directly reduces district revenue. The legislature has been paying attention. HB 106, filed by Rep. Andrew Stoddard (D-Sandy) during the 2026 session, would have required the Utah State Board of Education to gather and publish school-level absenteeism data and analyze root causes, including socioeconomic factors and mental health.
Meanwhile, the legislature in March 2026 fixed an emergency English learner funding program that had been on the books for a year without a single school qualifying. The original threshold required a 75% increase of at least 30 new EL students. The fix lowered it to a 40% increase of at least 10 students.
"We want to make sure that everyone's learning, and it's hard to do that if the classroom just doesn't have the resources." -- Sen. Heidi Balderree (R), KUER, March 2026
State reporting in March 2026 projected that 32 schools would qualify for the 2025-26 school year, accessing up to $500,000 per fiscal year in emergency EL funding.
What to watch
USBE's statewide attendance campaign, launched in August 2025, does not specifically target EL families. Its framing is universal: transportation, mental health, engagement. A community-based approach may not reach families whose absence is driven by fear of a federal agency rather than disengagement. The data so far suggests it has not.
The next published attendance data will show whether the January 2025 enforcement policy created a one-time attendance shock or a sustained shift. Logan City, where nearly half of all students are now chronically absent and the rate has more than tripled since pre-COVID, will be one place to watch. The other is whether the legislature's EL funding fix translates into the kind of targeted support, bilingual outreach workers, transportation assistance, family liaisons, that research associates with keeping immigrant families connected to schools.
Utah's chronic absence data shows broad improvement across nearly every dimension. The English learner gap is the exception that should worry policymakers most, because the students it describes are also the students least likely to have an advocate who can call the school board.
Detailed code that reproduces the analysis and figures in this article is available exclusively to EdTribune subscribers.
Discussion
Sign in to join the discussion.
Loading comments...