Nine of Utah's 41 traditional school districts have kept their chronic absenteeism rate below the statewide average every single year since 2015. Washington District↗ET, in the fast-growing St. George corridor, is one of them. It is also one of only 11 to post three consecutive years of improvement: from 19.8% in 2023 to 17.2% in 2024 to 15.4% in 2025, a total drop of 4.4 percentage points while the state rate sat frozen at 23.8%.
That gap between Washington and the state average widened to 8.4 points in 2025. In a state where only three of 41 traditional districts have returned to their pre-COVID attendance levels, this kind of sustained progress stands out.
What the trajectory looks like
Washington District's chronic absence rate climbed gradually through the late 2010s, rising from 10.2% in 2015 to 13.5% in 2019. Then came a pattern unique to Utah: the rate actually dropped to 7.3% in 2020, because Utah kept schools substantially open during the first pandemic year. The COVID attendance spike arrived late, slamming Washington to 23.0% in 2022, nearly triple its 2020 floor.
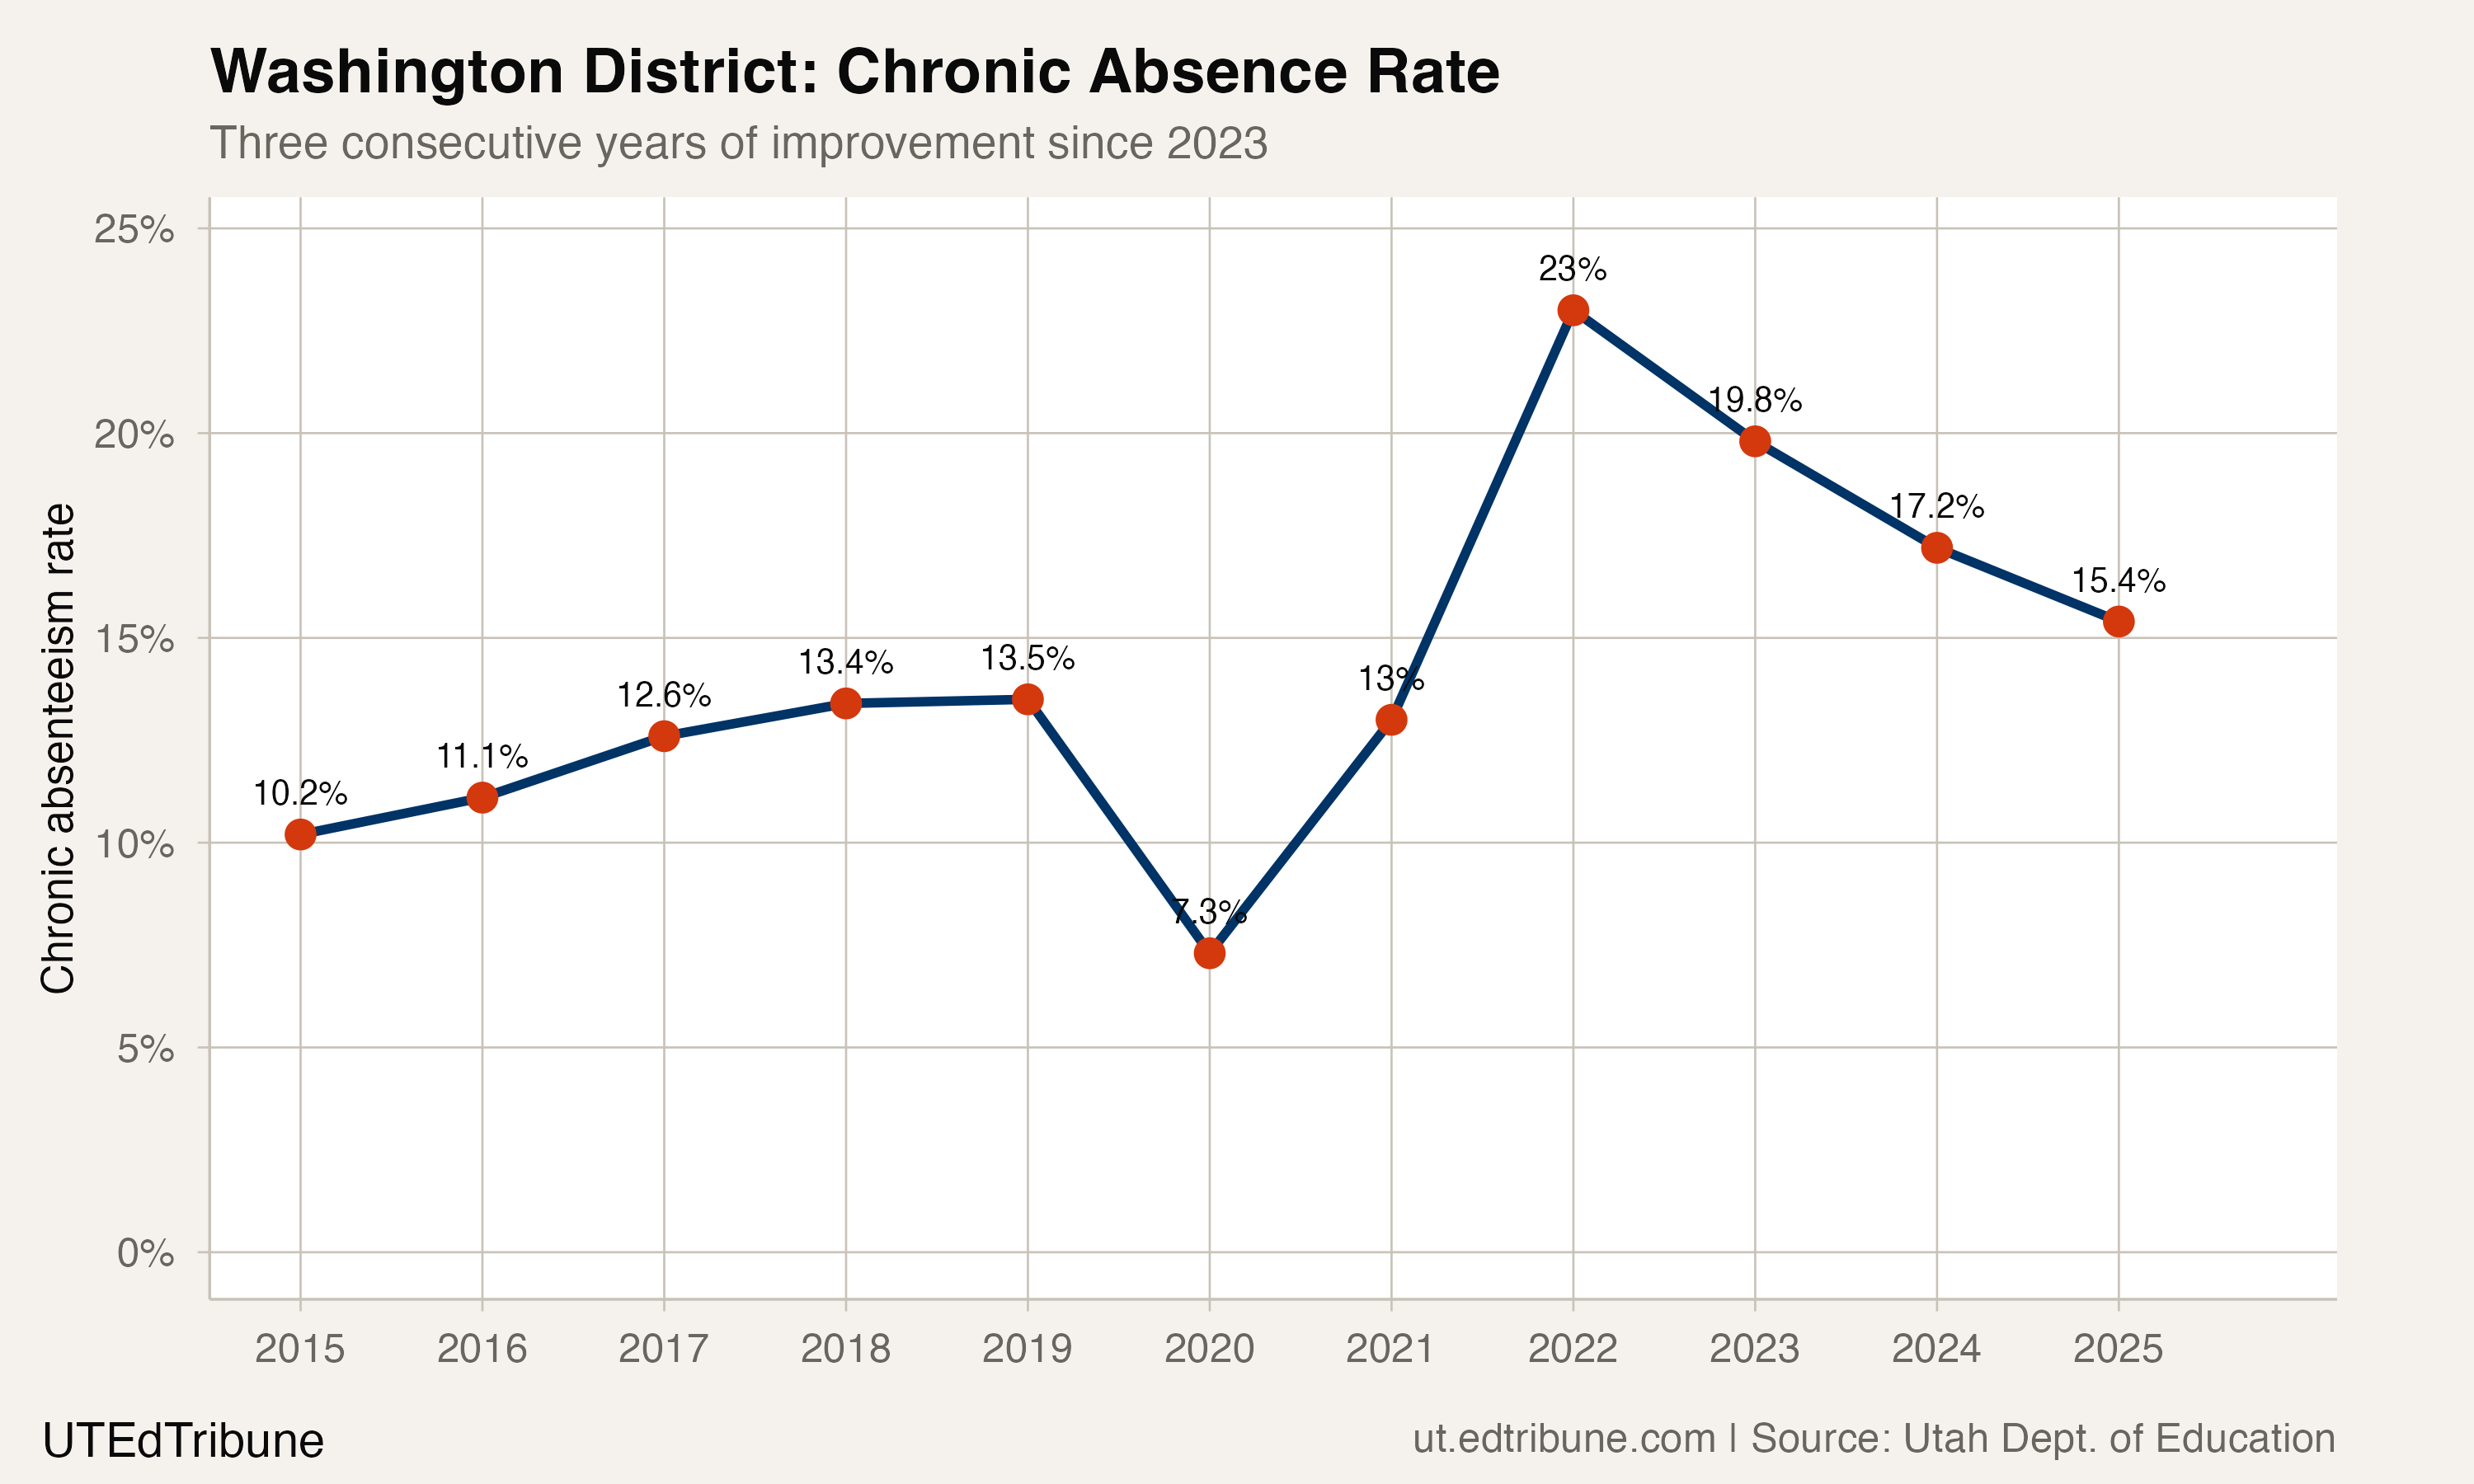
Since that 2022 peak, the district has recovered 7.6 percentage points. It now sits at 15.4%, still 1.9 points above its pre-COVID baseline of 13.5%. That 1.9-point excess is the sixth-smallest among Utah's 41 traditional districts.
For context: the typical traditional district in Utah carries a chronic absence rate of 25.6%, more than 10 points higher than Washington's. The statewide rate has not budged from 23.8% since 2024.
The St. George approach
Washington County School District serves roughly 37,000 students across 55 schools in the St. George area, one of Utah's fastest-growing communities. Washington County added an estimated 4,751 residents in 2024-25, the third-fastest growth rate among Utah counties, though much of that growth skews older, with a significant retiree population drawn to the region's climate.
The district's attendance strategy relies on site-based autonomy rather than a single top-down program. Individual schools design their own attendance plans, combining home visits, phone calls, individualized student plans, and data dashboards to catch problems early.
"Each school finds a plan that works best for them." Source: stgeorgeutah.com, Feb. 2025
The district has invested in PowerSchool analytics and recently expanded to Unified Insights dashboards that flag attendance dips before they become patterns. When early interventions fail, the district escalates to attendance mediation through juvenile justice and the Division of Child and Family Services. The district reports an 86% "consistent attendance" rate, compared to 78% statewide.
How peers compare
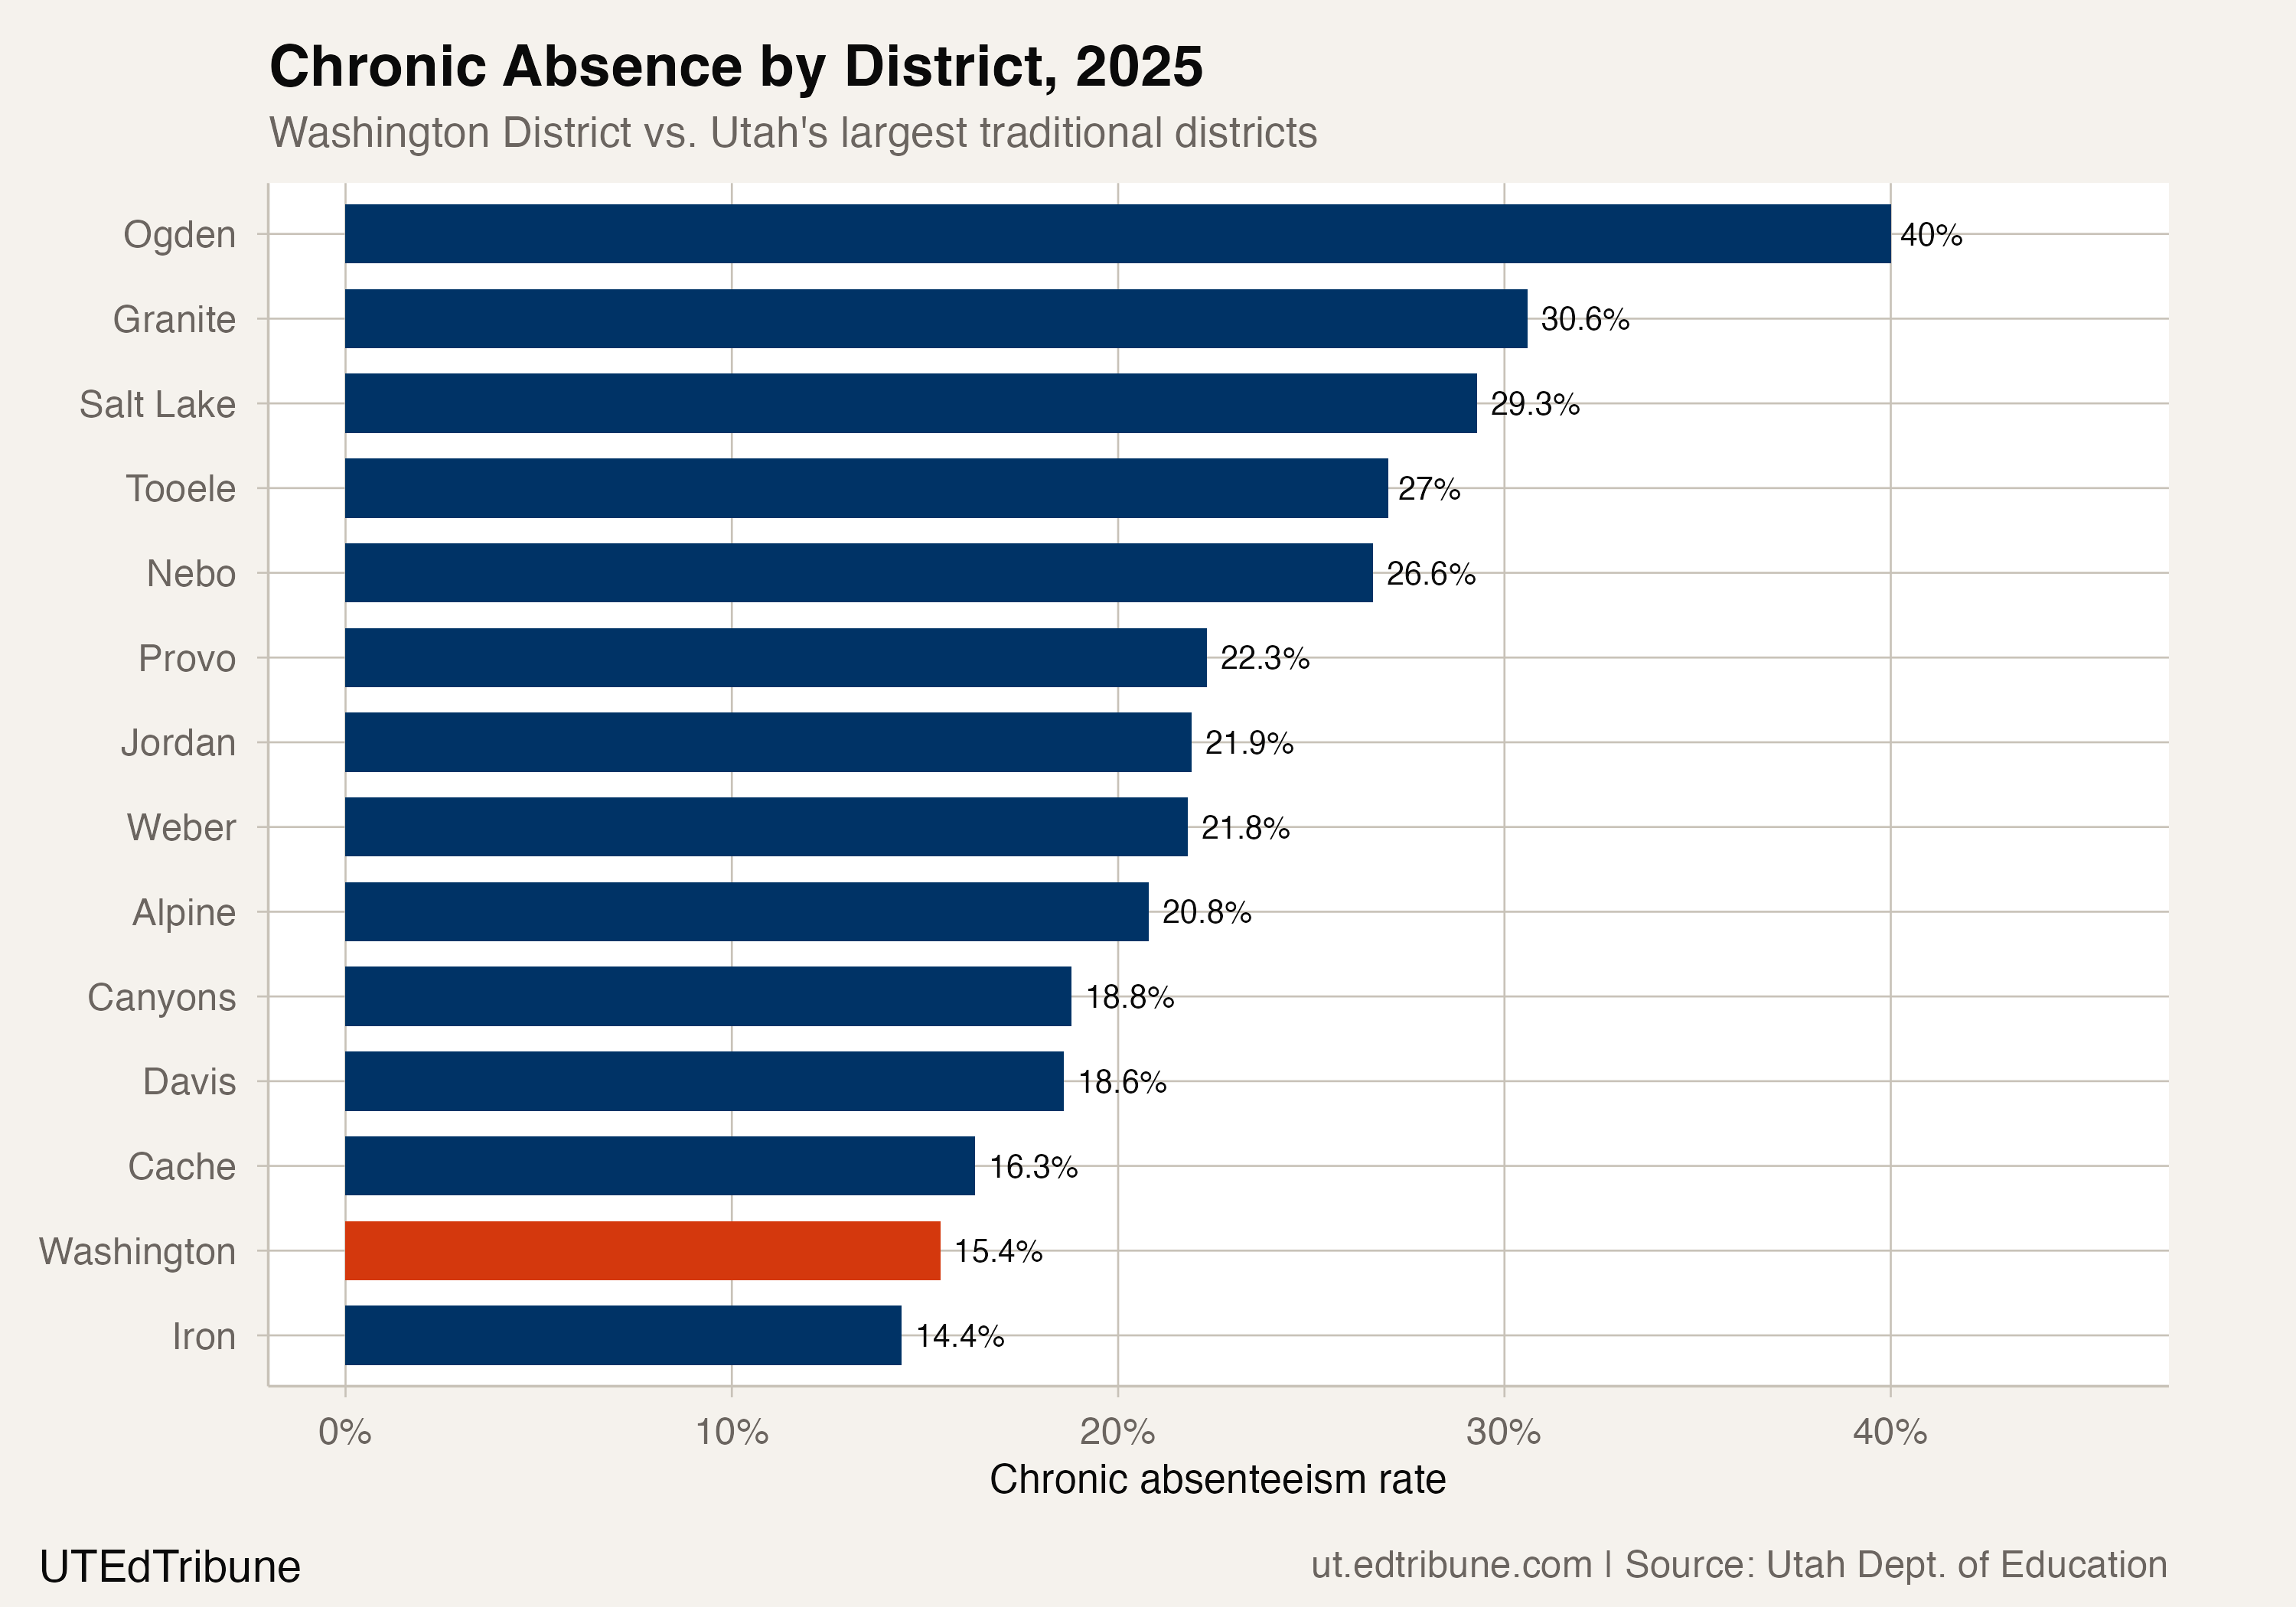
Among Utah's 14 largest traditional districts, Washington's 15.4% rate is the second-lowest, behind only Iron District at 14.4%. At the other extreme, Ogden City sits at 40.0% and Granite at 30.6%.
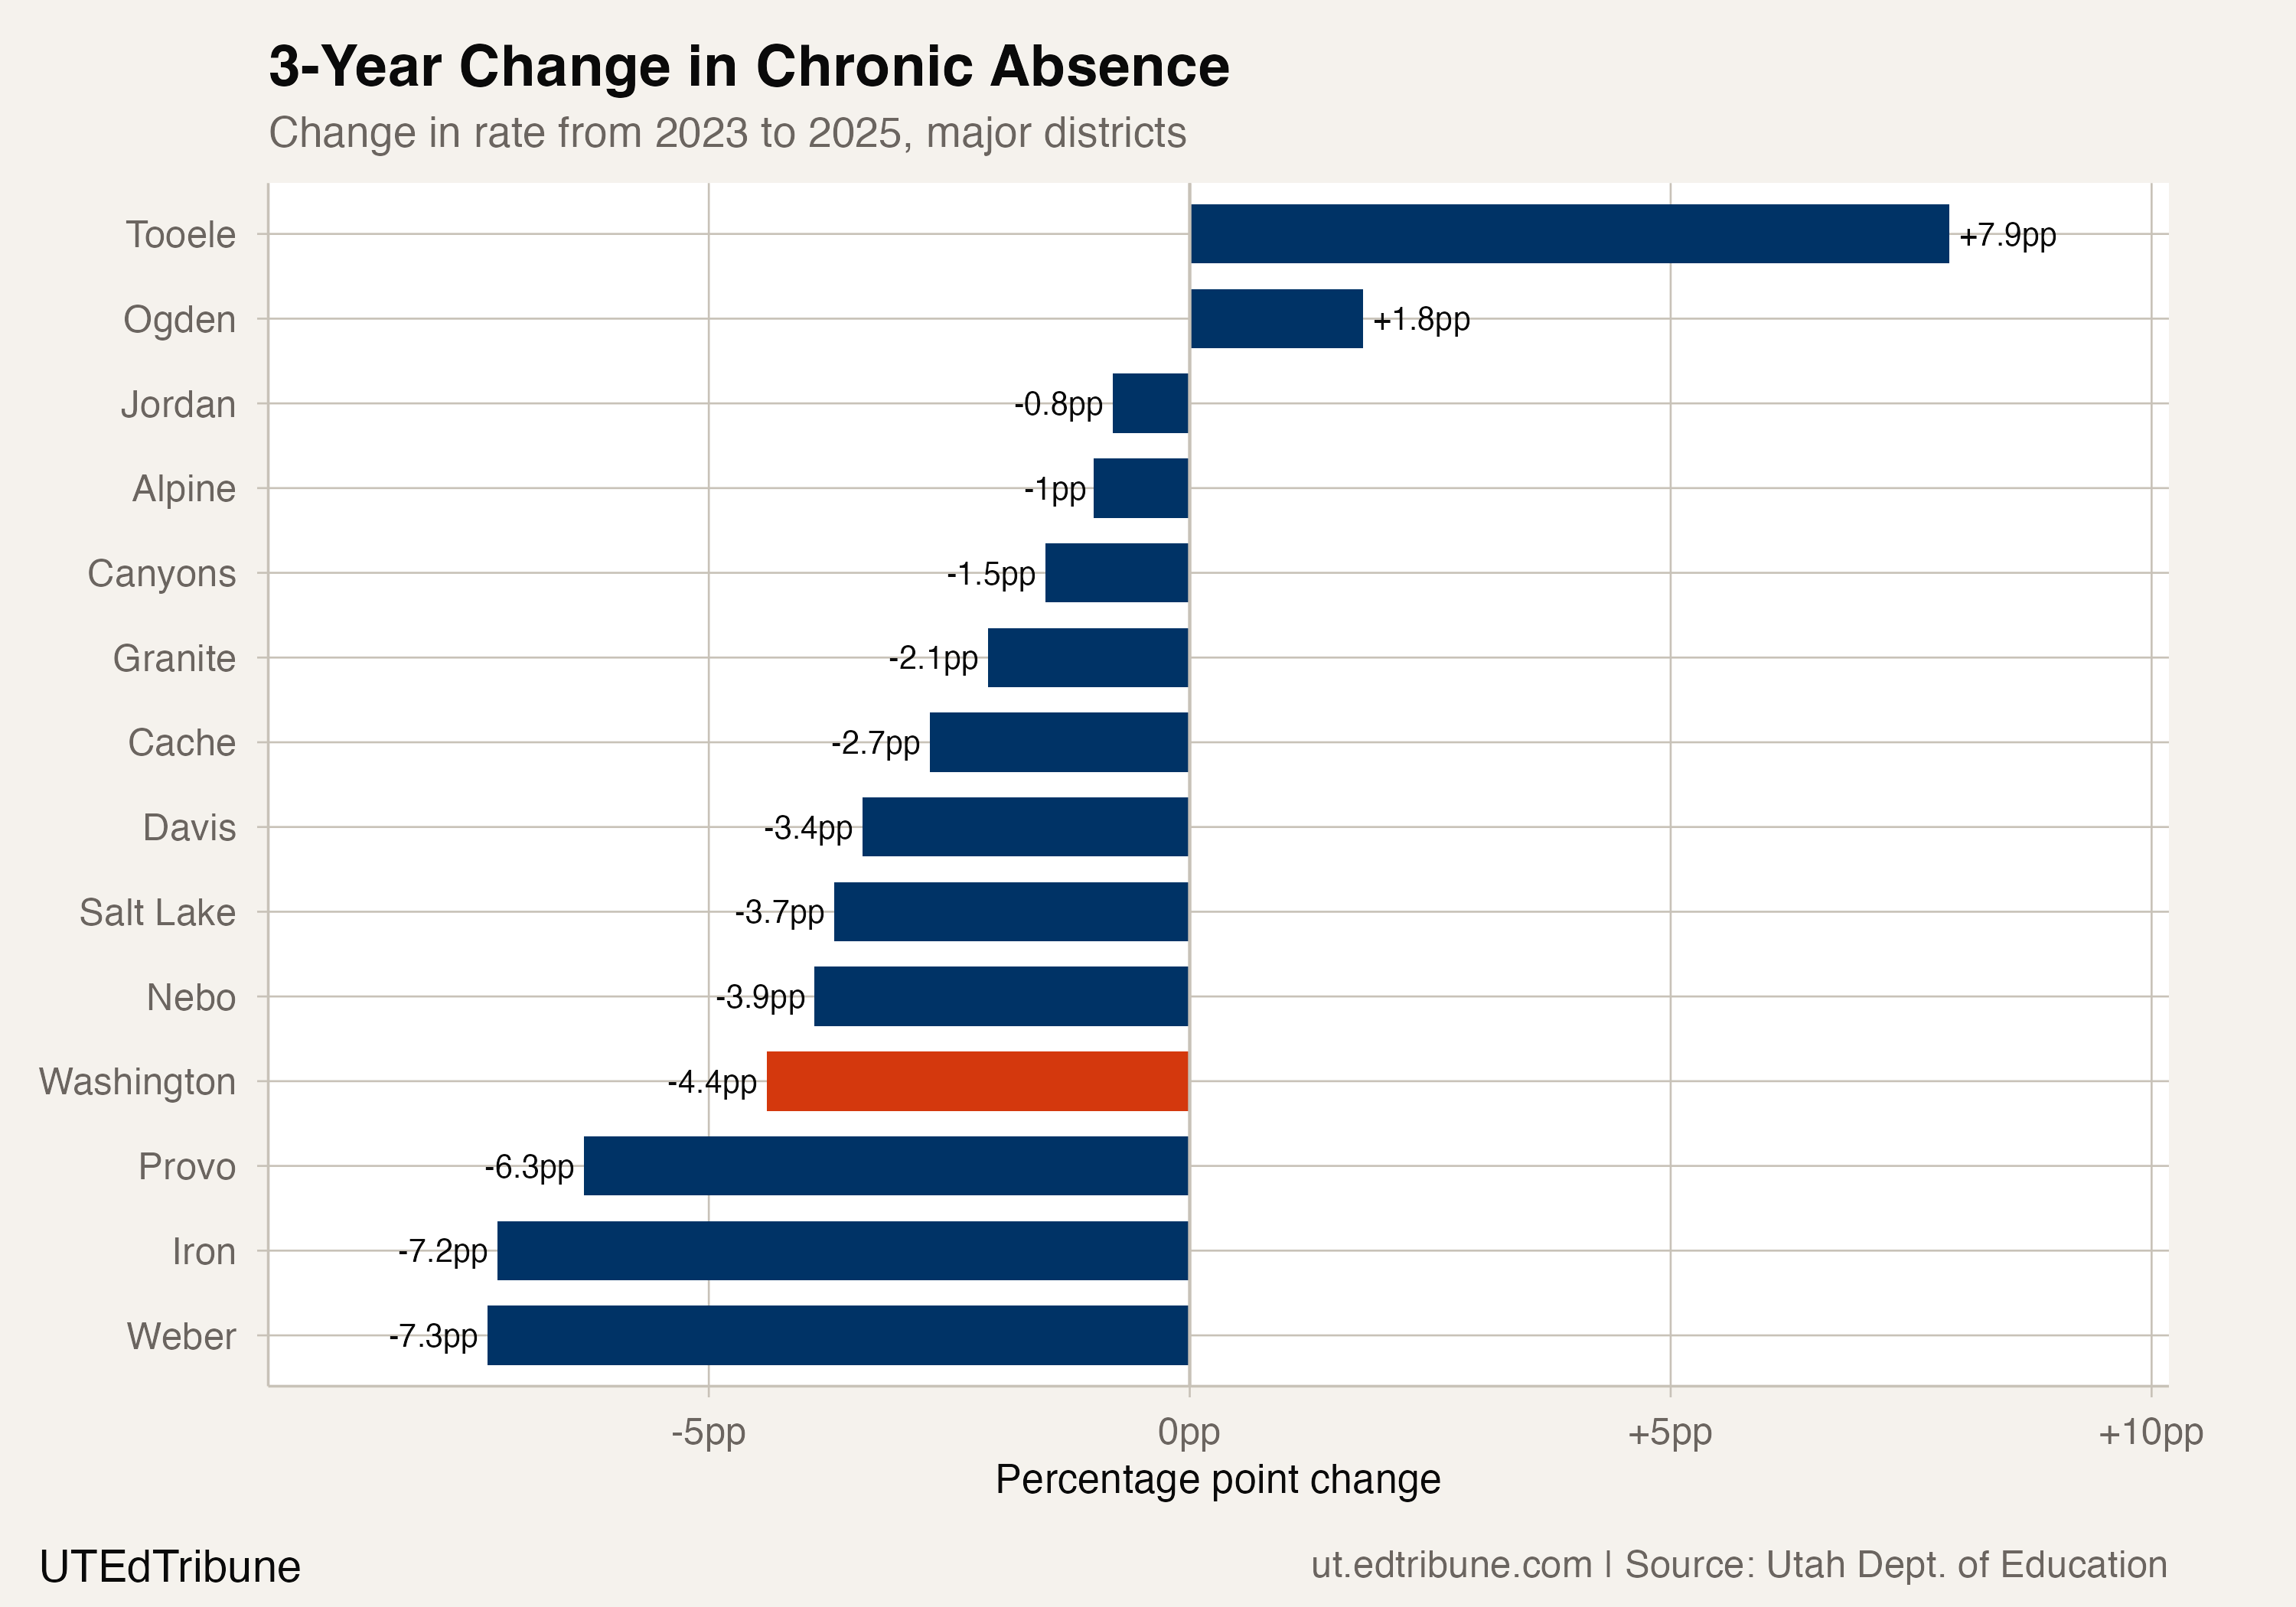
The three-year trajectory tells a sharper story. Weber District improved the most among large districts, dropping 7.3 points since 2023, though that followed a large spike. Iron fell 7.2 points. Washington's 4.4-point drop ranks fifth, but it started from a lower base: improving from 15% is harder than improving from 29%.
Two districts moved in the wrong direction: Tooele surged 7.9 points, from 19.1% to 27.0%. Ogden worsened by 1.8 points.
A consistent gap, widening
The most striking feature of Washington's record is its consistency. Over 11 years, the district has never once exceeded the traditional district average. The gap has always been there. What changed is that it grew: in 2015, Washington trailed the average by about 8 points. By 2025, that gap stretched past 10.
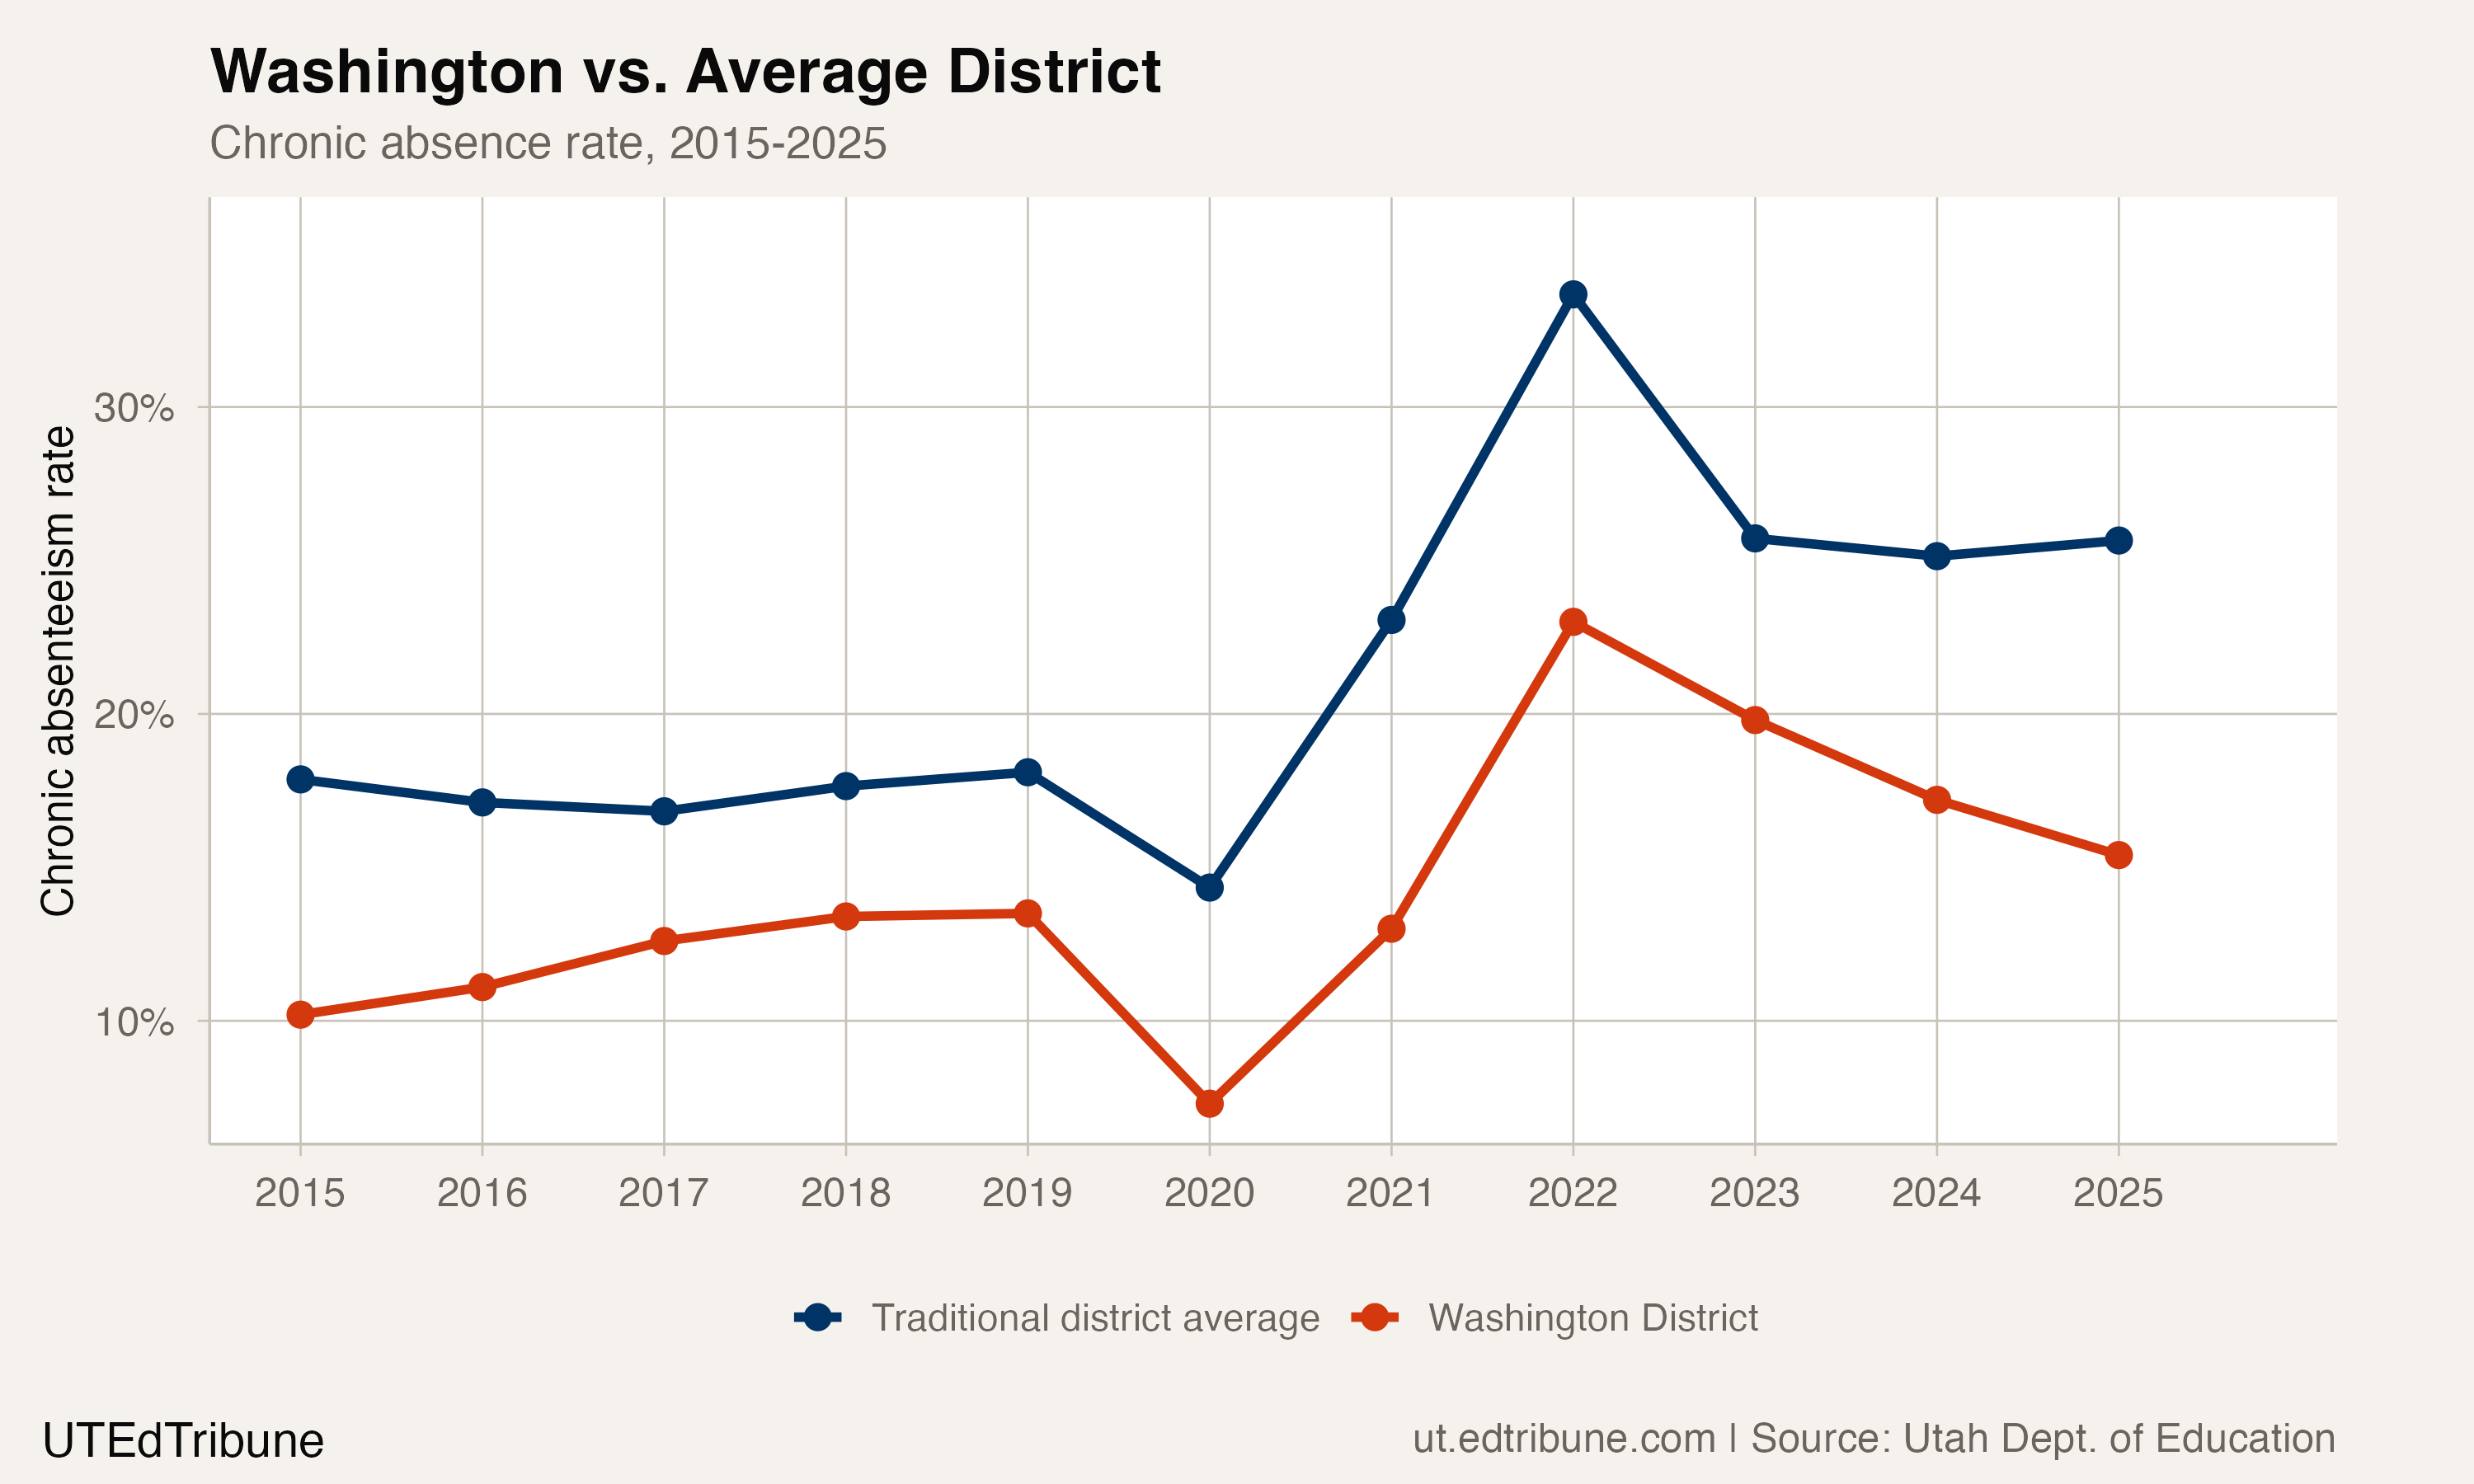
This suggests something structural, not programmatic. A new initiative might explain a one-year improvement. A decade of outperformance points to community characteristics, institutional culture, or both.
One plausible factor is self-selection. St. George is a destination community: families move there by choice, not by default. That may produce a school population with more stable housing, stronger family networks, and fewer of the social disruptions that drive chronic absence in districts like Ogden (40.0%) or Logan (43.7%), where concentrated poverty and refugee resettlement create different attendance dynamics.
Another possibility: measurement. Utah currently lacks uniform statewide definitions for attendance tracking, a gap that SB 58 in the 2026 legislative session aims to close. Until definitions are standardized, cross-district comparisons carry a small asterisk.
The state is watching
Washington's improvement comes as Utah confronts a broader attendance crisis. Nearly one in four students statewide is chronically absent, a rate that nearly doubled from 12.2% in 2014 to 23.8% in 2024. USBE launched the "Every Day Counts" campaign in August 2025 to combat the problem, emphasizing the same community-based, school-level flexibility that Washington District was already practicing.
"Our 'Every Day Counts' campaign is about working alongside families to remove barriers to attendance." State Superintendent Molly Hart, KSL, Aug. 2025
The campaign's philosophy mirrors Washington's approach. Whether other districts can replicate the results is a different question. Washington's advantages (a growing community with lower poverty than urban Utah, a long-running investment in attendance analytics, and no single acute crisis like the ones overwhelming Uintah at 50.9% or Ogden) are not easily transferred.
The honest question is whether Washington's path represents a model or an anomaly. Eleven districts posted three-year improvement streaks. But 38 of 41 remain above their pre-COVID rates. Washington is closer to recovery than almost anyone, still 1.9 points short of where it was in 2019. The problem is that 1.9 points looks like a rounding error next to what districts like Salt Lake (29.3%) and Uintah (50.9%) are still carrying.
At 15.4%, Washington District has not solved chronic absenteeism. But in a state where nearly every district is still searching for the bottom, it has at least found a direction.
Detailed code that reproduces the analysis and figures in this article is available exclusively to EdTribune subscribers.
Discussion
Sign in to join the discussion.
Loading comments...