Correction: An earlier version of this article stated that Hispanic students make up roughly 19% of Utah enrollment. The correct figure is roughly 21%. The article has been updated.
The number is 34.4%. That is the share of economically disadvantaged students in Utah who missed at least 10% of school days in 2024-25. It means more than one in three low-income students in the state is chronically absent, a rate that has held flat for two consecutive years while the state average also stalled at 23.8%.
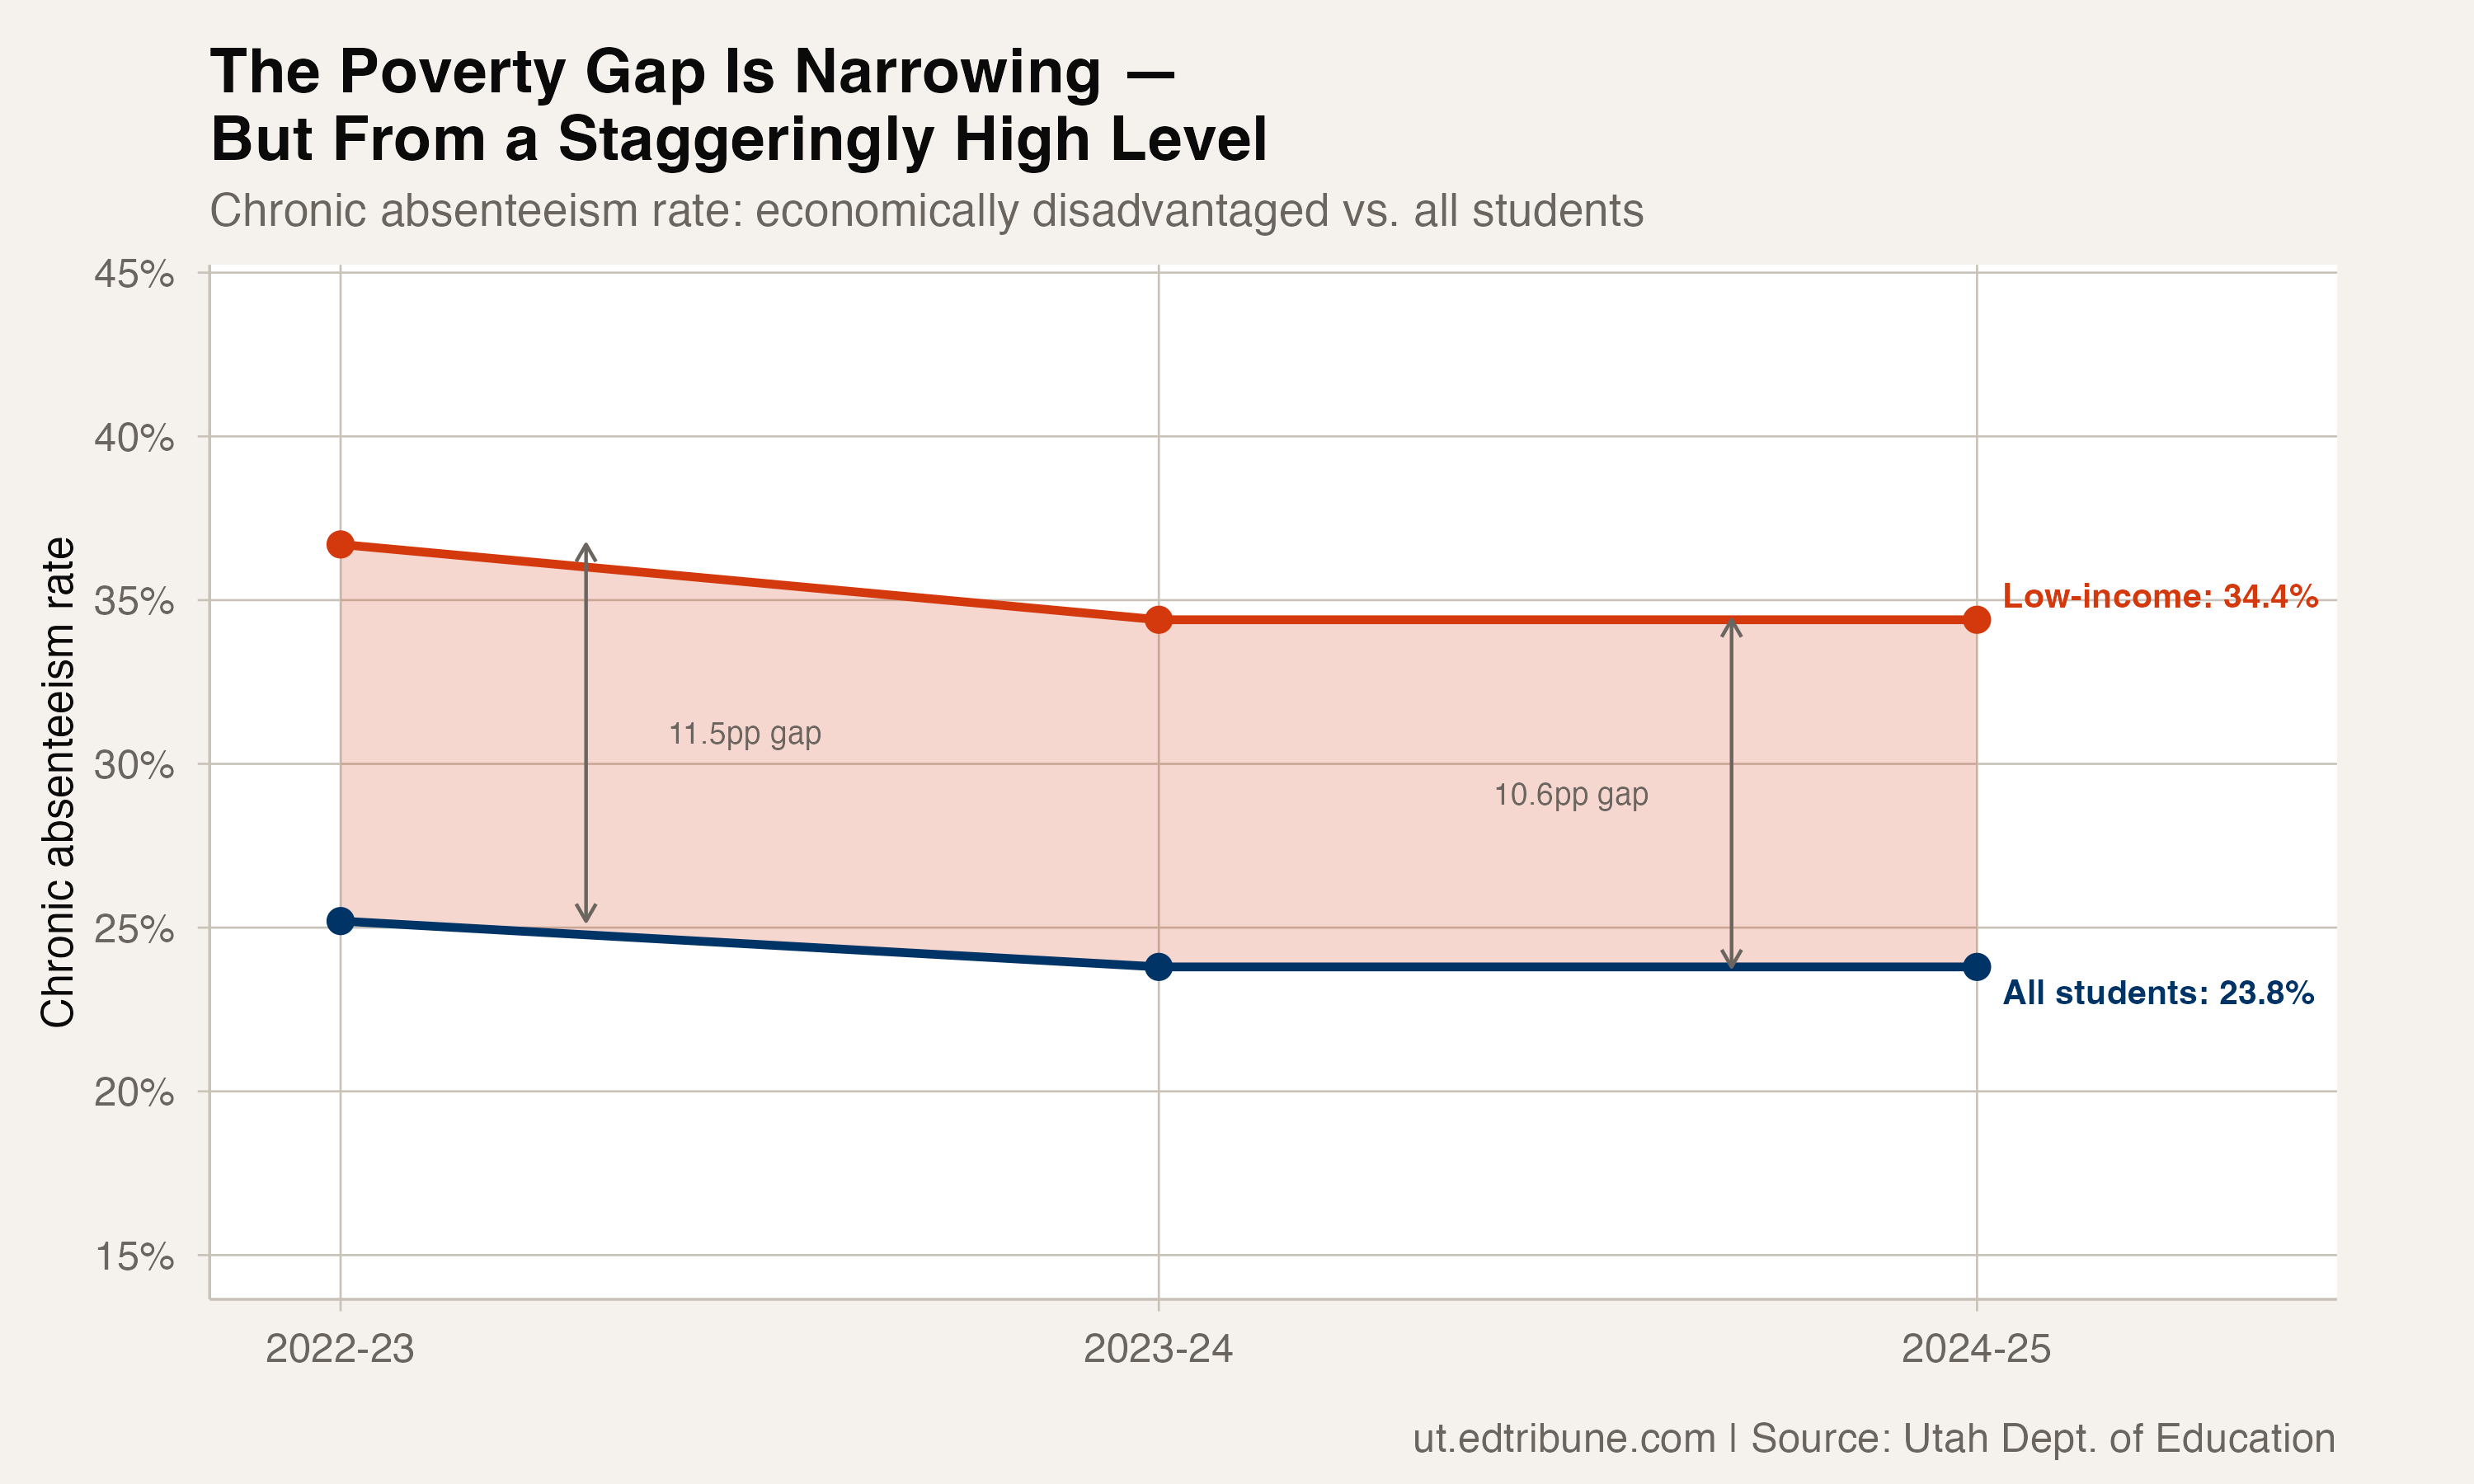
The poverty gap in attendance, the distance between low-income students and the state average, stands at 10.6 percentage points. It narrowed slightly from 11.5 points in 2022-23, the first year Utah reported statewide demographic breakdowns for chronic absenteeism. But the improvement came from both groups declining at roughly similar rates, not from low-income students catching up faster. The ratio has barely moved: economically disadvantaged students miss school at 1.45 times the overall rate, essentially unchanged over three years.
Where the burden falls hardest
Poverty is not the only predictor of chronic absence in Utah, but it sits at the center of a web of overlapping disadvantages. English learners face the state's steepest attendance burden among special populations: 36.2% chronically absent in 2024-25, up from 35.9% two years earlier. That makes LEP students the only special population group whose rate worsened over the three-year window while every other subgroup either improved or held steady.
Special education students are chronically absent at 30.0%, down from 32.3% in 2022-23, meaningful progress, though still 6.2 percentage points above the state average.
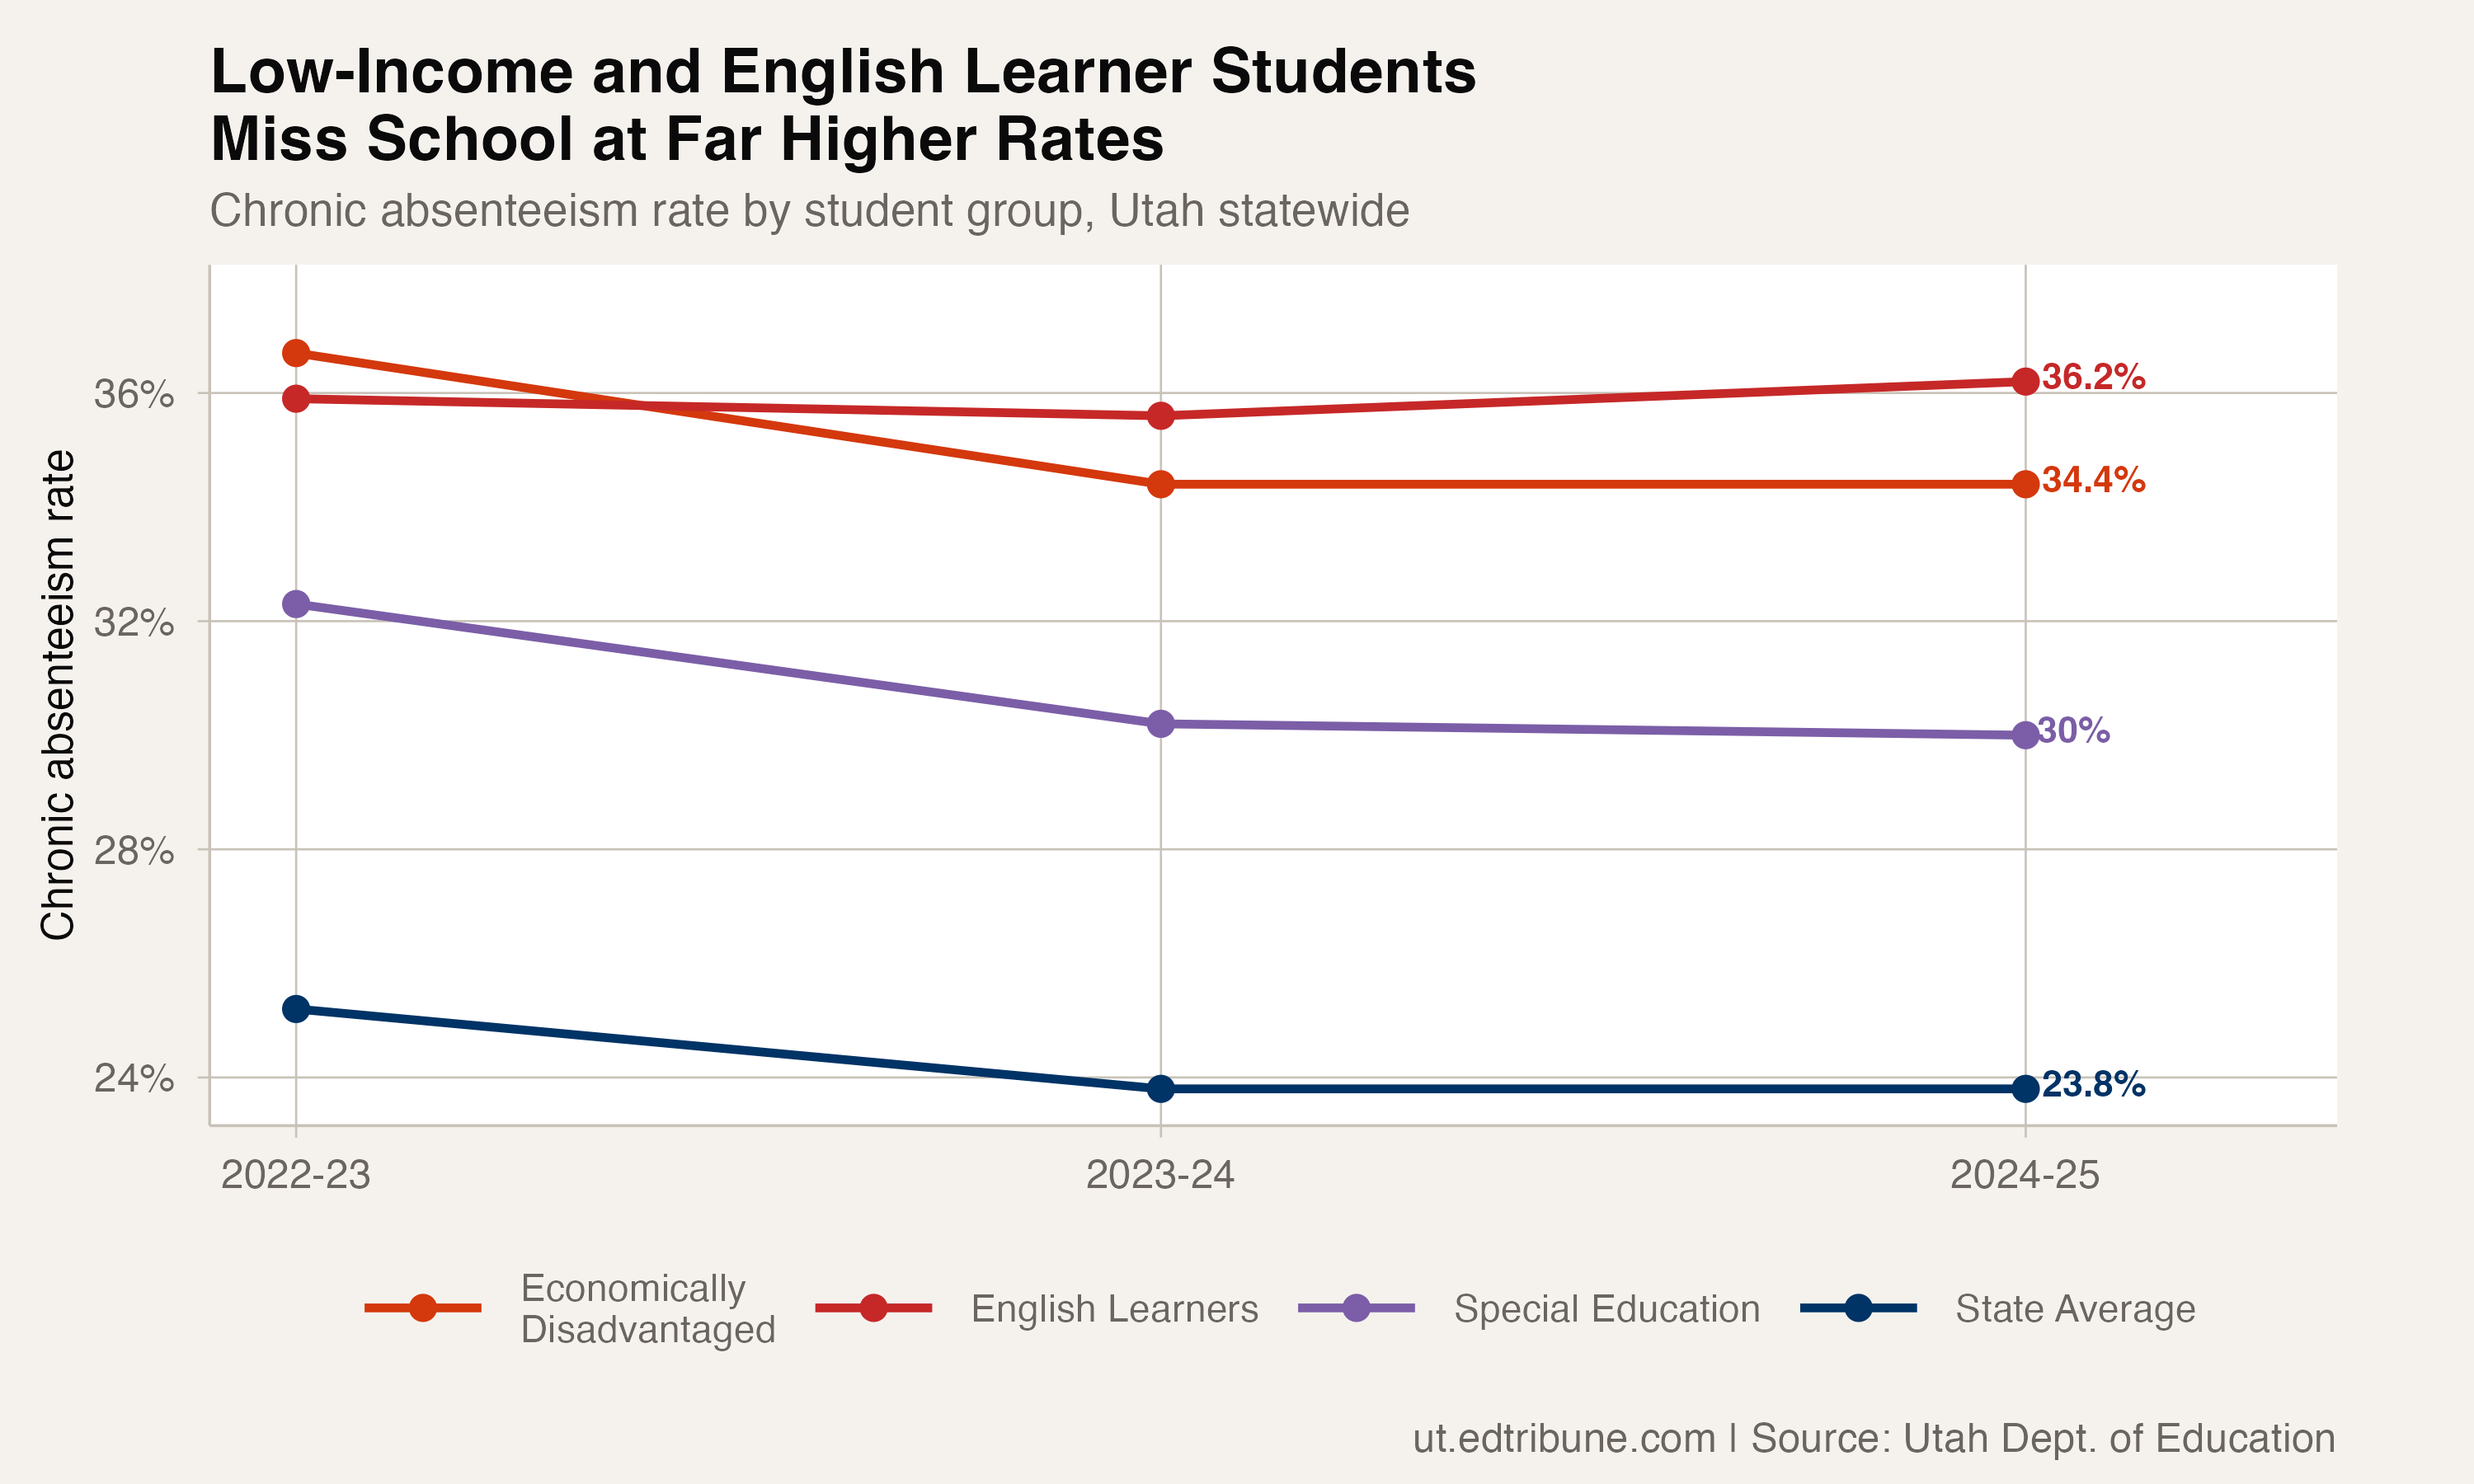
The trajectories tell different stories. Economically disadvantaged students and English learners have both plateaued at rates above 34%. Special education students are the one group showing sustained improvement, dropping 2.3 points over three years. The overall state rate dropped 1.4 points from 2022-23 to 2023-24, then froze.
The full picture of who's missing
Utah's chronic absenteeism data, available at the state level with demographic breakdowns only since 2022-23, reveals a layered attendance crisis where race, poverty, and language compound.
Pacific Islander students face the highest chronic absenteeism rate of any racial or ethnic group: 45.0% in 2024-25, more than 21 percentage points above the state average and more than double the rate for white students. Native American students follow at 39.8%, a rate connected to attendance challenges on tribal lands documented elsewhere in this series. Hispanic students, the state's largest minority group at roughly 21% of enrollment, sit at 33.0%.
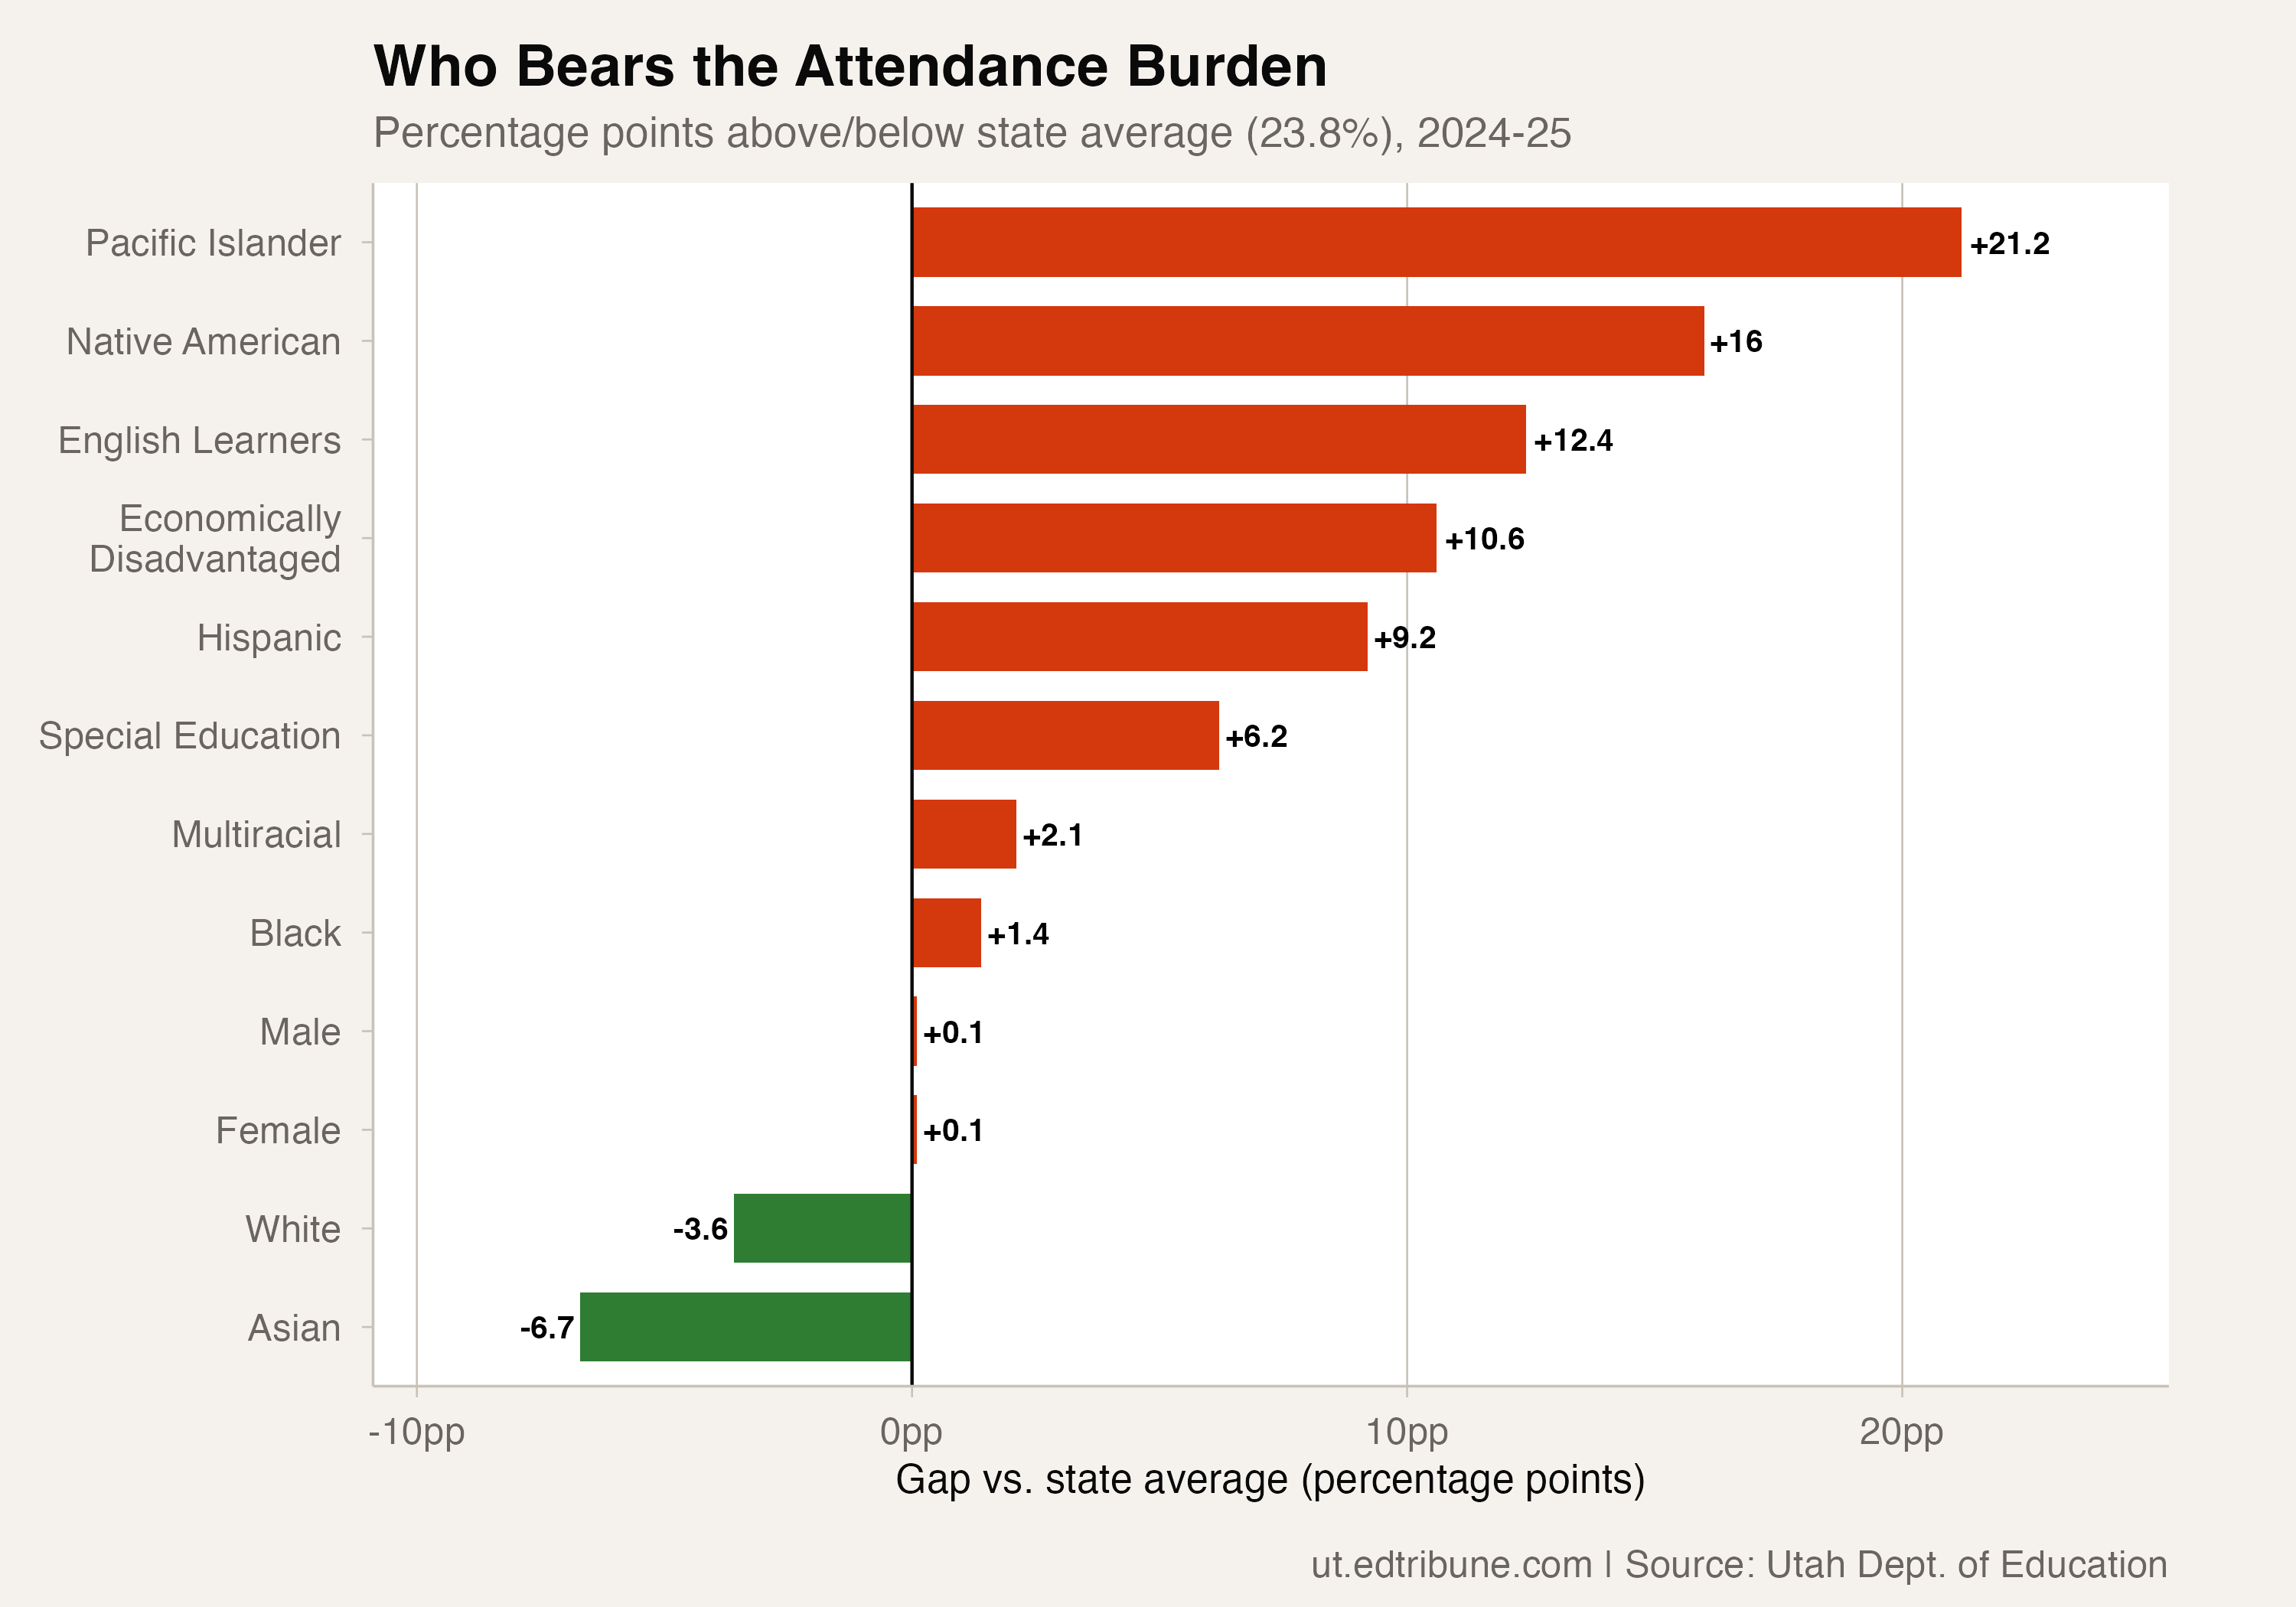
At the other end: white students at 20.2% and Asian students at 17.1% are the only racial groups below the state average. The gap between the highest-rate group (Pacific Islander, 45.0%) and the lowest (Asian, 17.1%) is 27.9 percentage points. Male and female students are chronically absent at identical rates of 23.9%, one of the few dimensions where Utah shows no attendance gap.
A gap that narrowed, from an alarming level
The poverty gap's slight narrowing, from 11.5 to 10.6 percentage points between 2022-23 and 2024-25, is real but modest. Most of the improvement happened in a single year: economically disadvantaged students dropped from 36.7% to 34.4% between 2022-23 and 2023-24, matching the broader statewide improvement. In 2024-25, both the low-income rate and the state average flatlined.
The stall raises a difficult question. Utah's "Every Day Counts" campaign, launched by the State Board of Education in August 2025, takes a community-based, non-punitive approach to the attendance crisis. Voices for Utah Children and United Way of Salt Lake have both identified the poverty-attendance intersection as a priority. But the data available so far (three years, all post-pandemic) cannot distinguish whether the 2024-25 plateau reflects a structural floor that policy interventions have yet to break through, or simply a pause before further improvement.
One important caveat: Utah does not break down subgroup rates by district or school. The statewide 34.4% rate for economically disadvantaged students cannot be decomposed to show whether low-income students in high-poverty urban districts like Ogden face worse attendance than their peers in affluent suburbs. That granularity does not exist in the published data, which limits how precisely the state can target interventions.
Utah's WPU-based funding formula, which ties school funding to Average Daily Membership, adds a compounding pressure: poverty drives absence, and absence erodes the funding needed to address it.
Detailed code that reproduces the analysis and figures in this article is available exclusively to EdTribune subscribers.
Discussion
Sign in to join the discussion.
Loading comments...