In 2020, charter schools in Utah lost students while traditional districts gained nearly 9,000. Six years later, those trajectories have reversed so completely that the two sectors no longer appear to share the same enrollment climate. In 2025-26, charter schools added 3,413 students, a 4.2% increase. Traditional districts lost 14,955, a 2.5% decline. The combined swing of 18,368 students between sectors is the largest single-year divergence in the eight years of available district-level data.
Charter schools now serve 85,268 students, 13.0% of Utah's public enrollment, up from 11.9% in 2019. That share had bounced between 11.5% and 11.9% for four straight years before breaking upward in 2025 and accelerating in 2026.
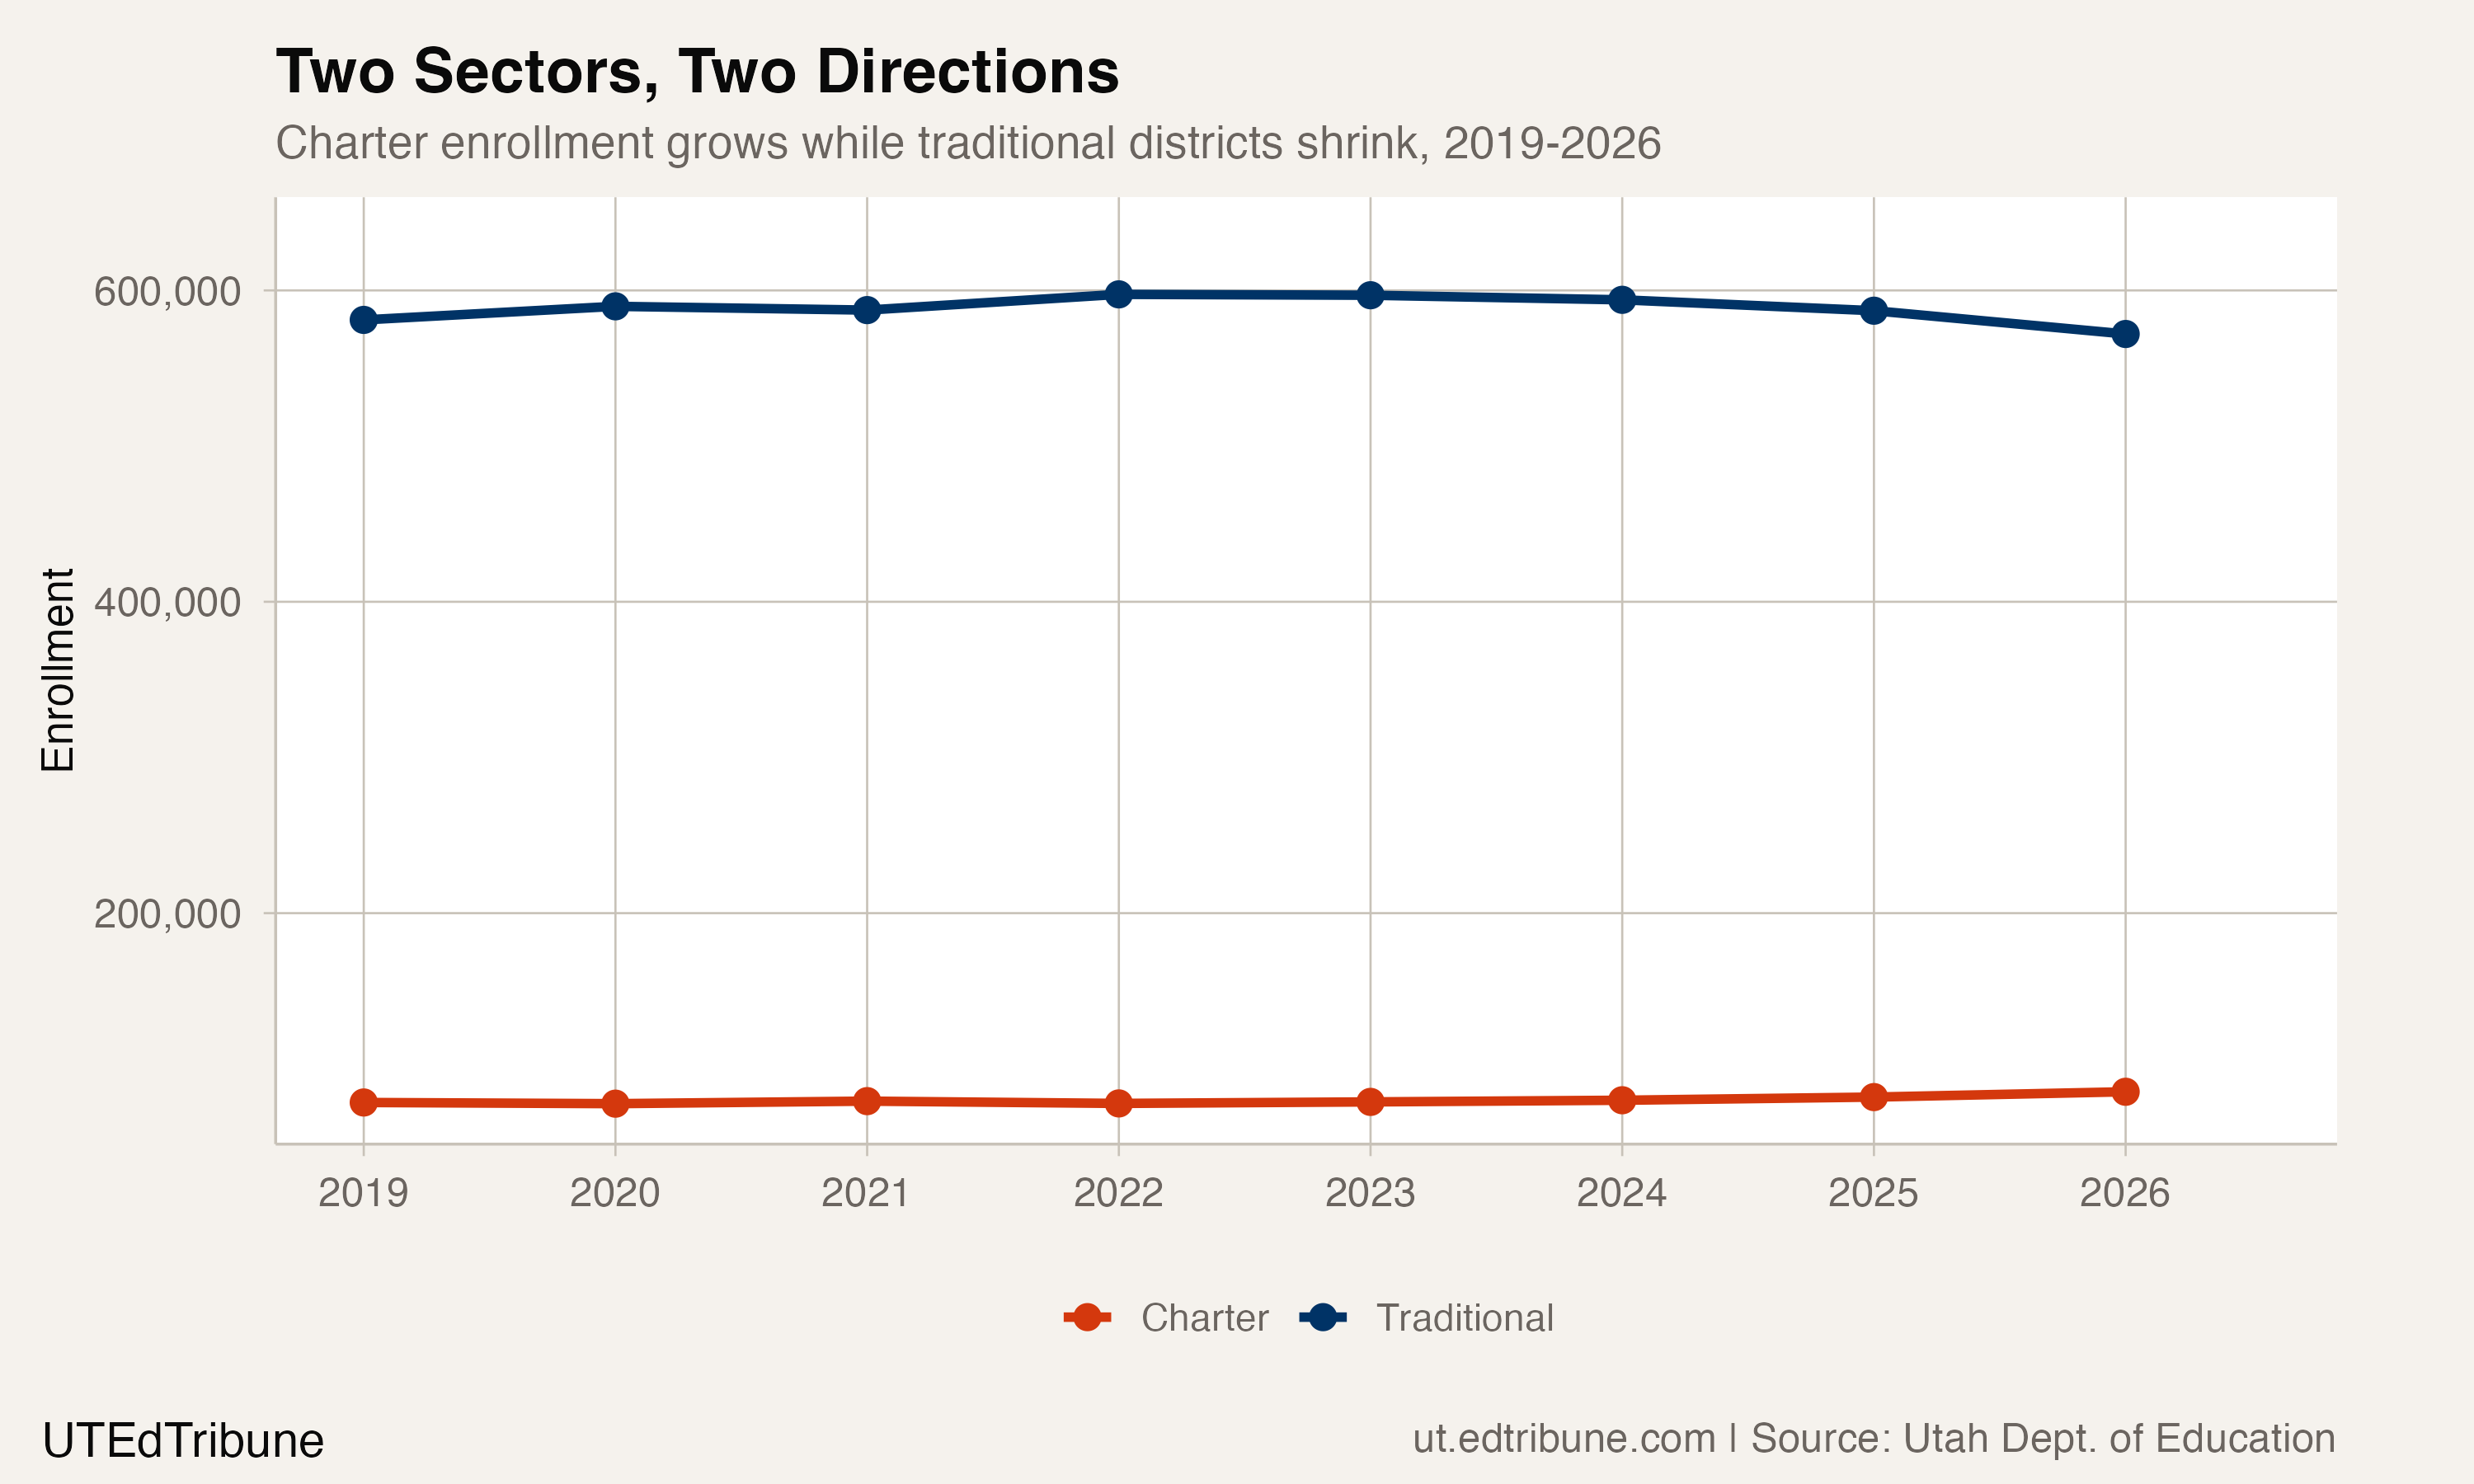
A reversal that took six years to build
The divergence did not arrive suddenly. In 2019-20, traditional districts grew by 8,719 students while charters shrank by 754. That was the last year both sectors moved in the same direction as overall enrollment. From 2021 onward, the two lines began to separate: traditional districts oscillated between modest gains and modest losses, while charters posted small but consistent growth.
Then came 2026. Traditional district losses nearly tripled, from 6,988 the prior year to 14,955. Charter growth nearly doubled, from 2,032 to 3,413. The result: a gap between sector growth rates that dwarfs anything in previous years.
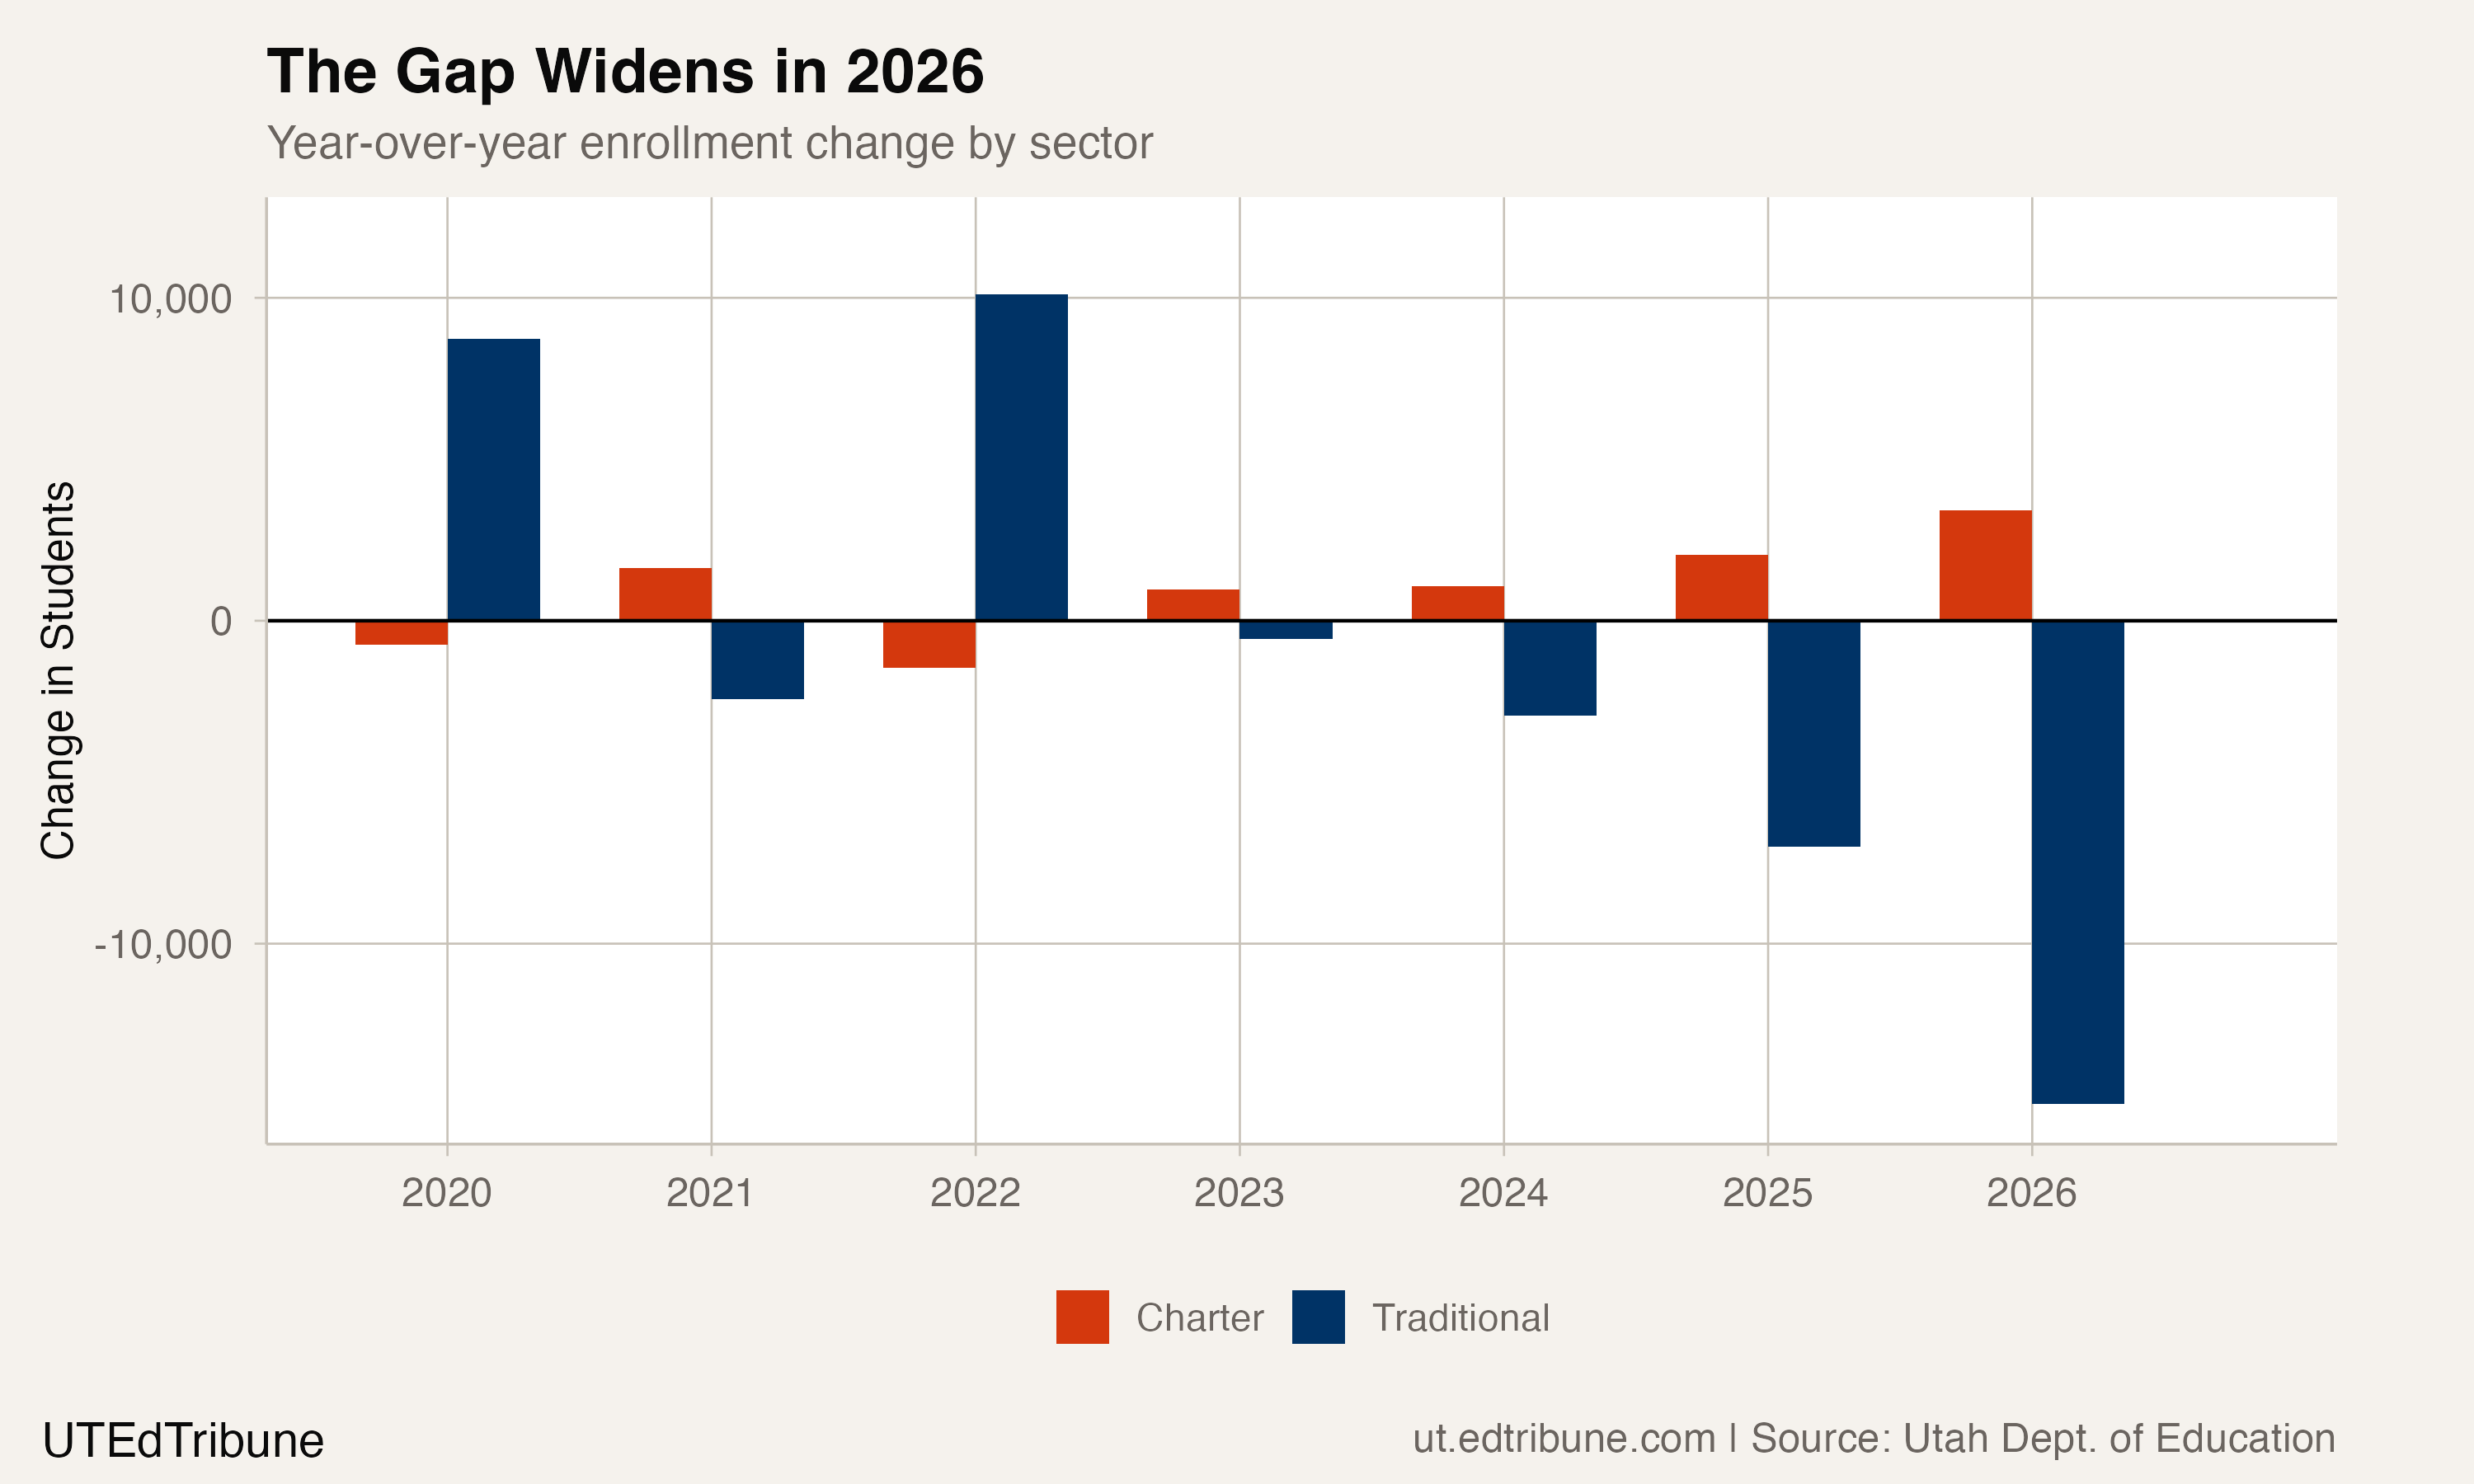
Over the full 2019-2026 period, charters have gained 6,884 students (8.8%) while traditional districts have lost 9,047 (1.6%). Nearly 80% of the charter growth came in the last two years alone. Traditional districts actually gained enrollment in 2020 and 2022 before the bottom fell out: the 21,943 students lost in 2025 and 2026 combined far exceeds the cumulative seven-year net loss.
37 of 41 traditional districts shrank
The traditional sector's losses are not concentrated in a few struggling urban systems. Thirty-seven of Utah's 41 traditional districts lost students in 2026. Only Tooele (+118), Logan City (+19), Beaver (+18), and Grand (+5) gained.
Granite District led losses at 2,571 students, a 4.5% decline. Davis lost 2,136 (3.1%), Washington 1,610 (4.5%), Nebo 1,271 (3.0%), and Jordan 1,263 (2.2%). Salt Lake District lost 886 students, a 4.8% rate. Even Alpine, the state's largest traditional district at 84,215 students, shrank by 542.
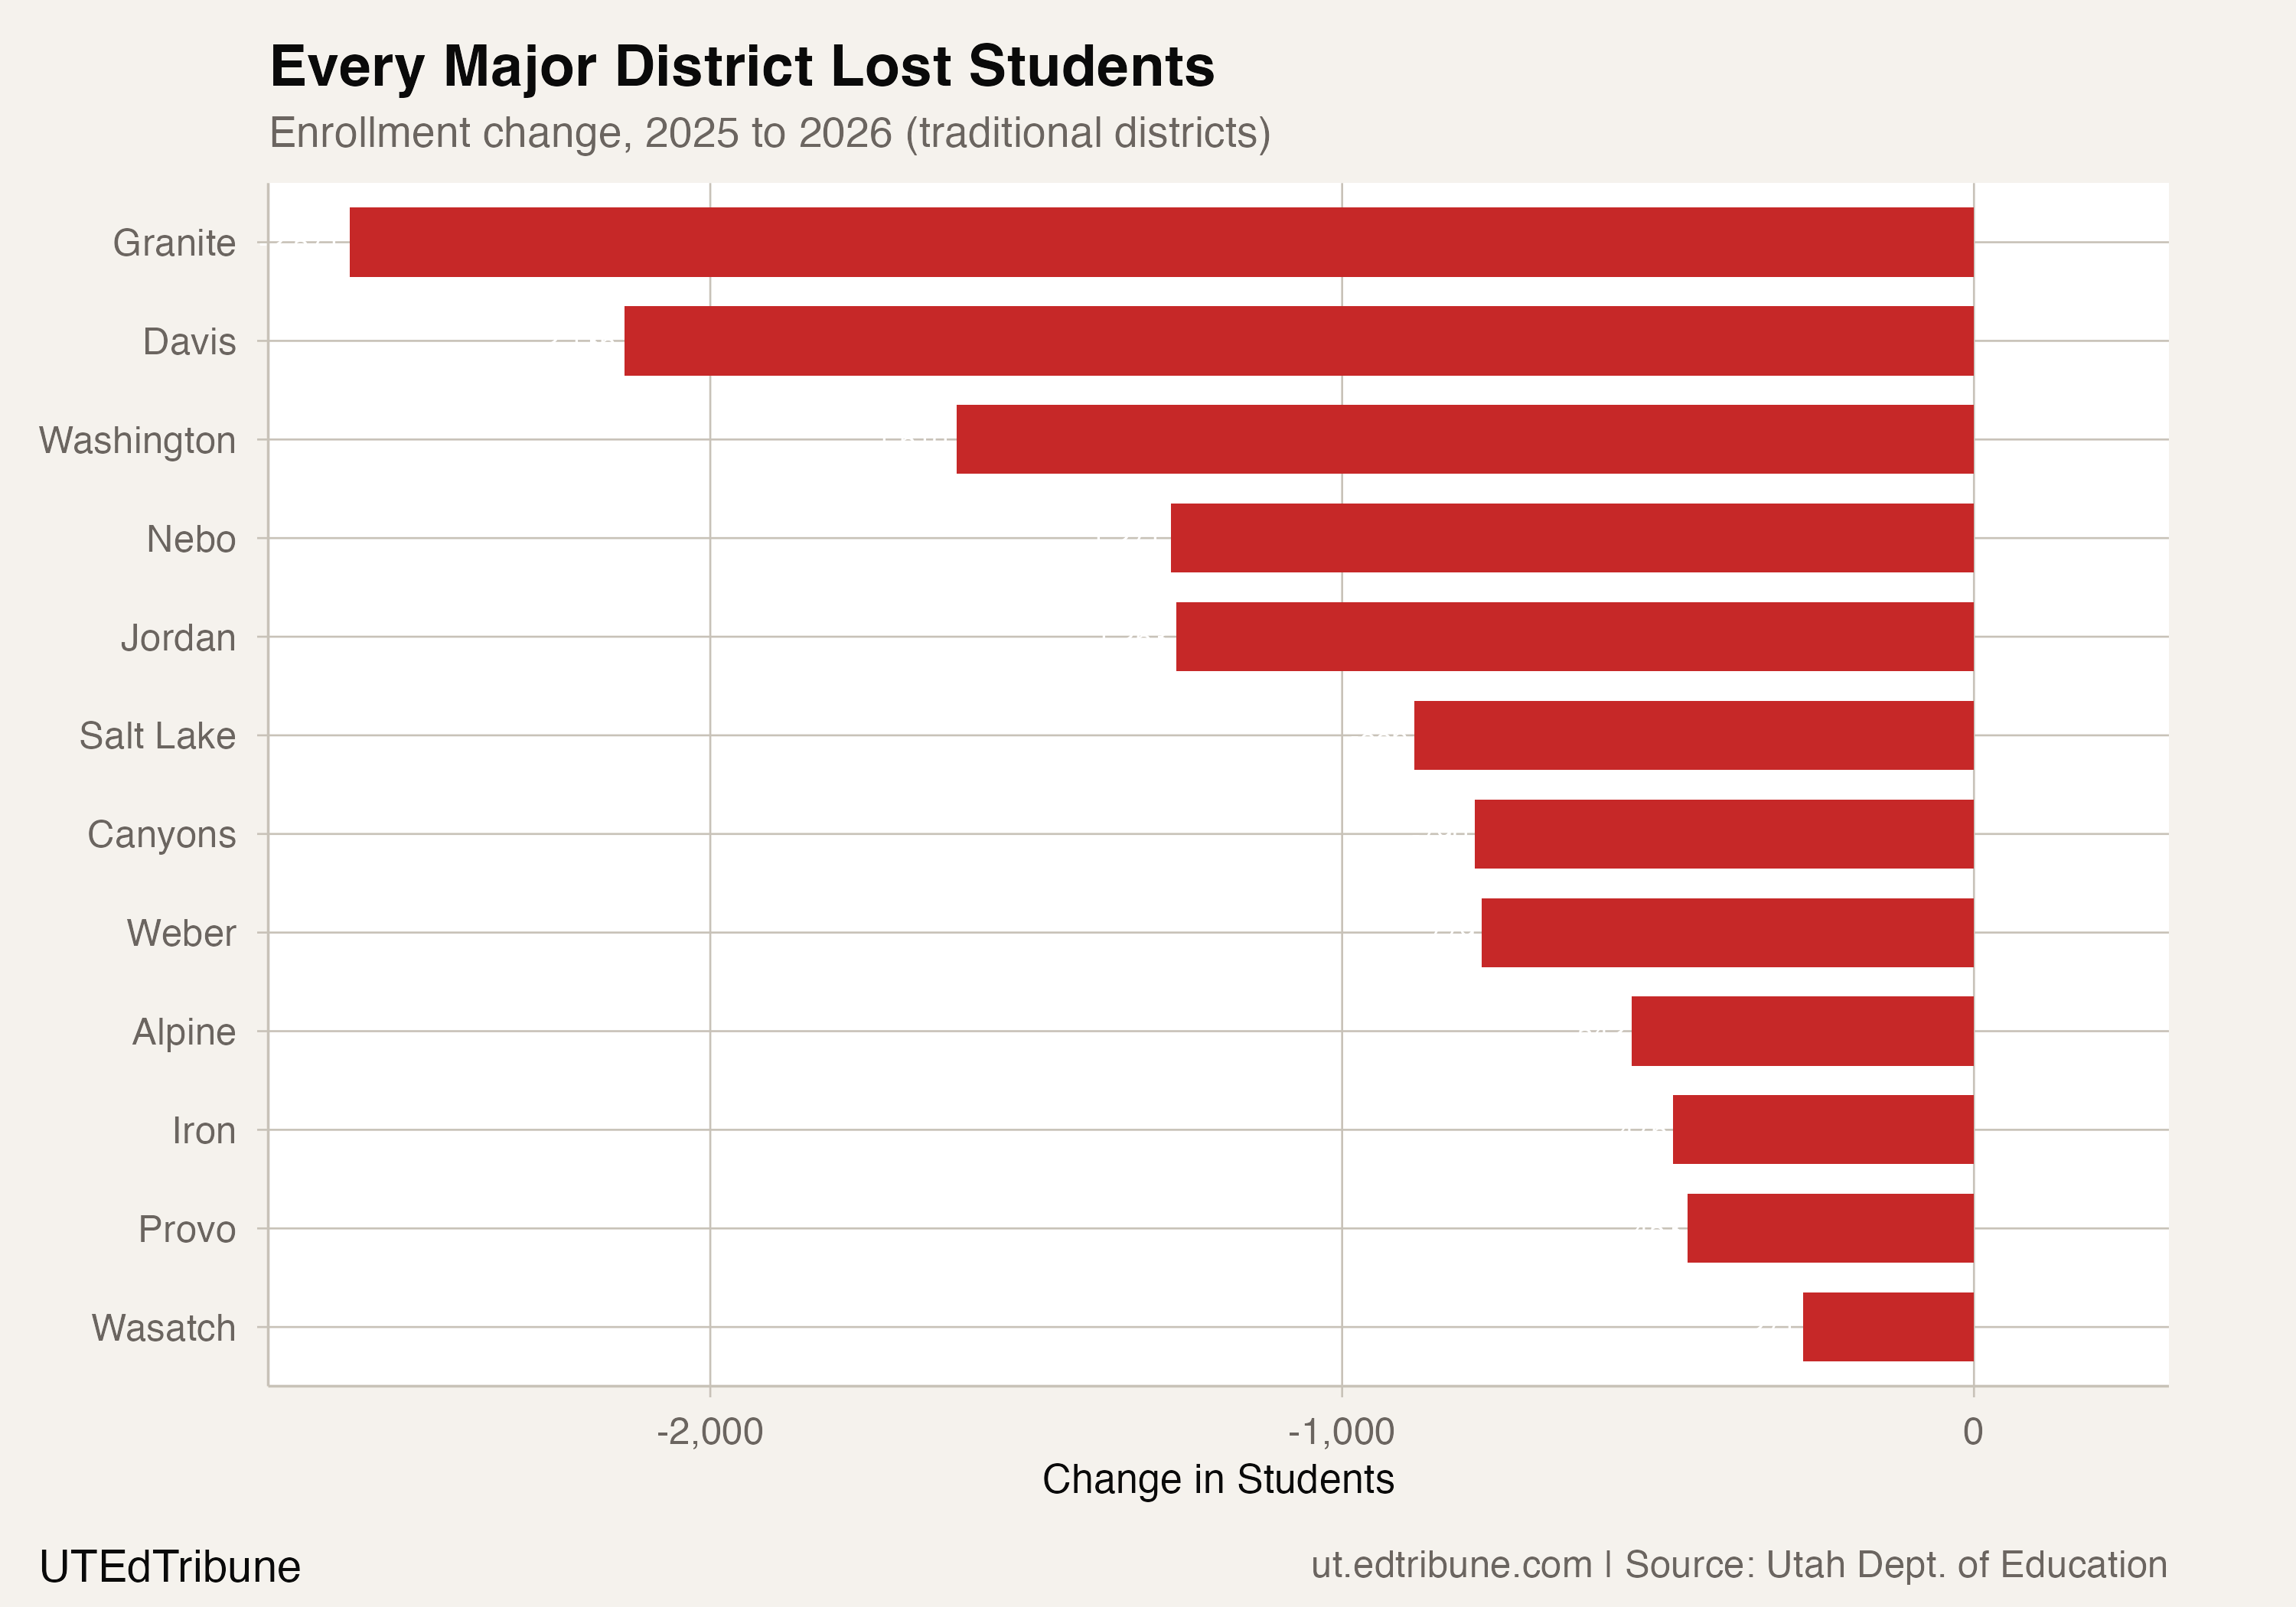
The losses span urban, suburban, and rural districts alike. Among the largest districts, Salt Lake posted a 4.8% decline, while Granite and Washington each posted 4.5% declines, a rate that would have been exceptional in any prior year in the dataset.
Charter growth is concentrated, not universal
The charter sector's 4.2% growth masks uneven results. Of 109 charter schools operating in both years, 54 gained students and 50 lost them. Five were flat. The sector's net gain of 3,413 was driven primarily by a handful of expanding schools.
Gateway Preparatory Academy, based in Enoch, tripled from 737 to 2,223 students in one year, accounting for 1,486 of the sector's net gain. The Utah State Charter School Board approved a 2,000-student expansion for Gateway in early 2025, and the school received a $1.5 million grant to support facility construction.
Wallace Stegner Academy, which has expanded to four campuses including new locations in Kearns and Sunset, grew by 682 students. Salt Lake Academy High School, only in its third year, added 491. Syracuse Arts Academy, approved for a satellite campus, grew by 332.
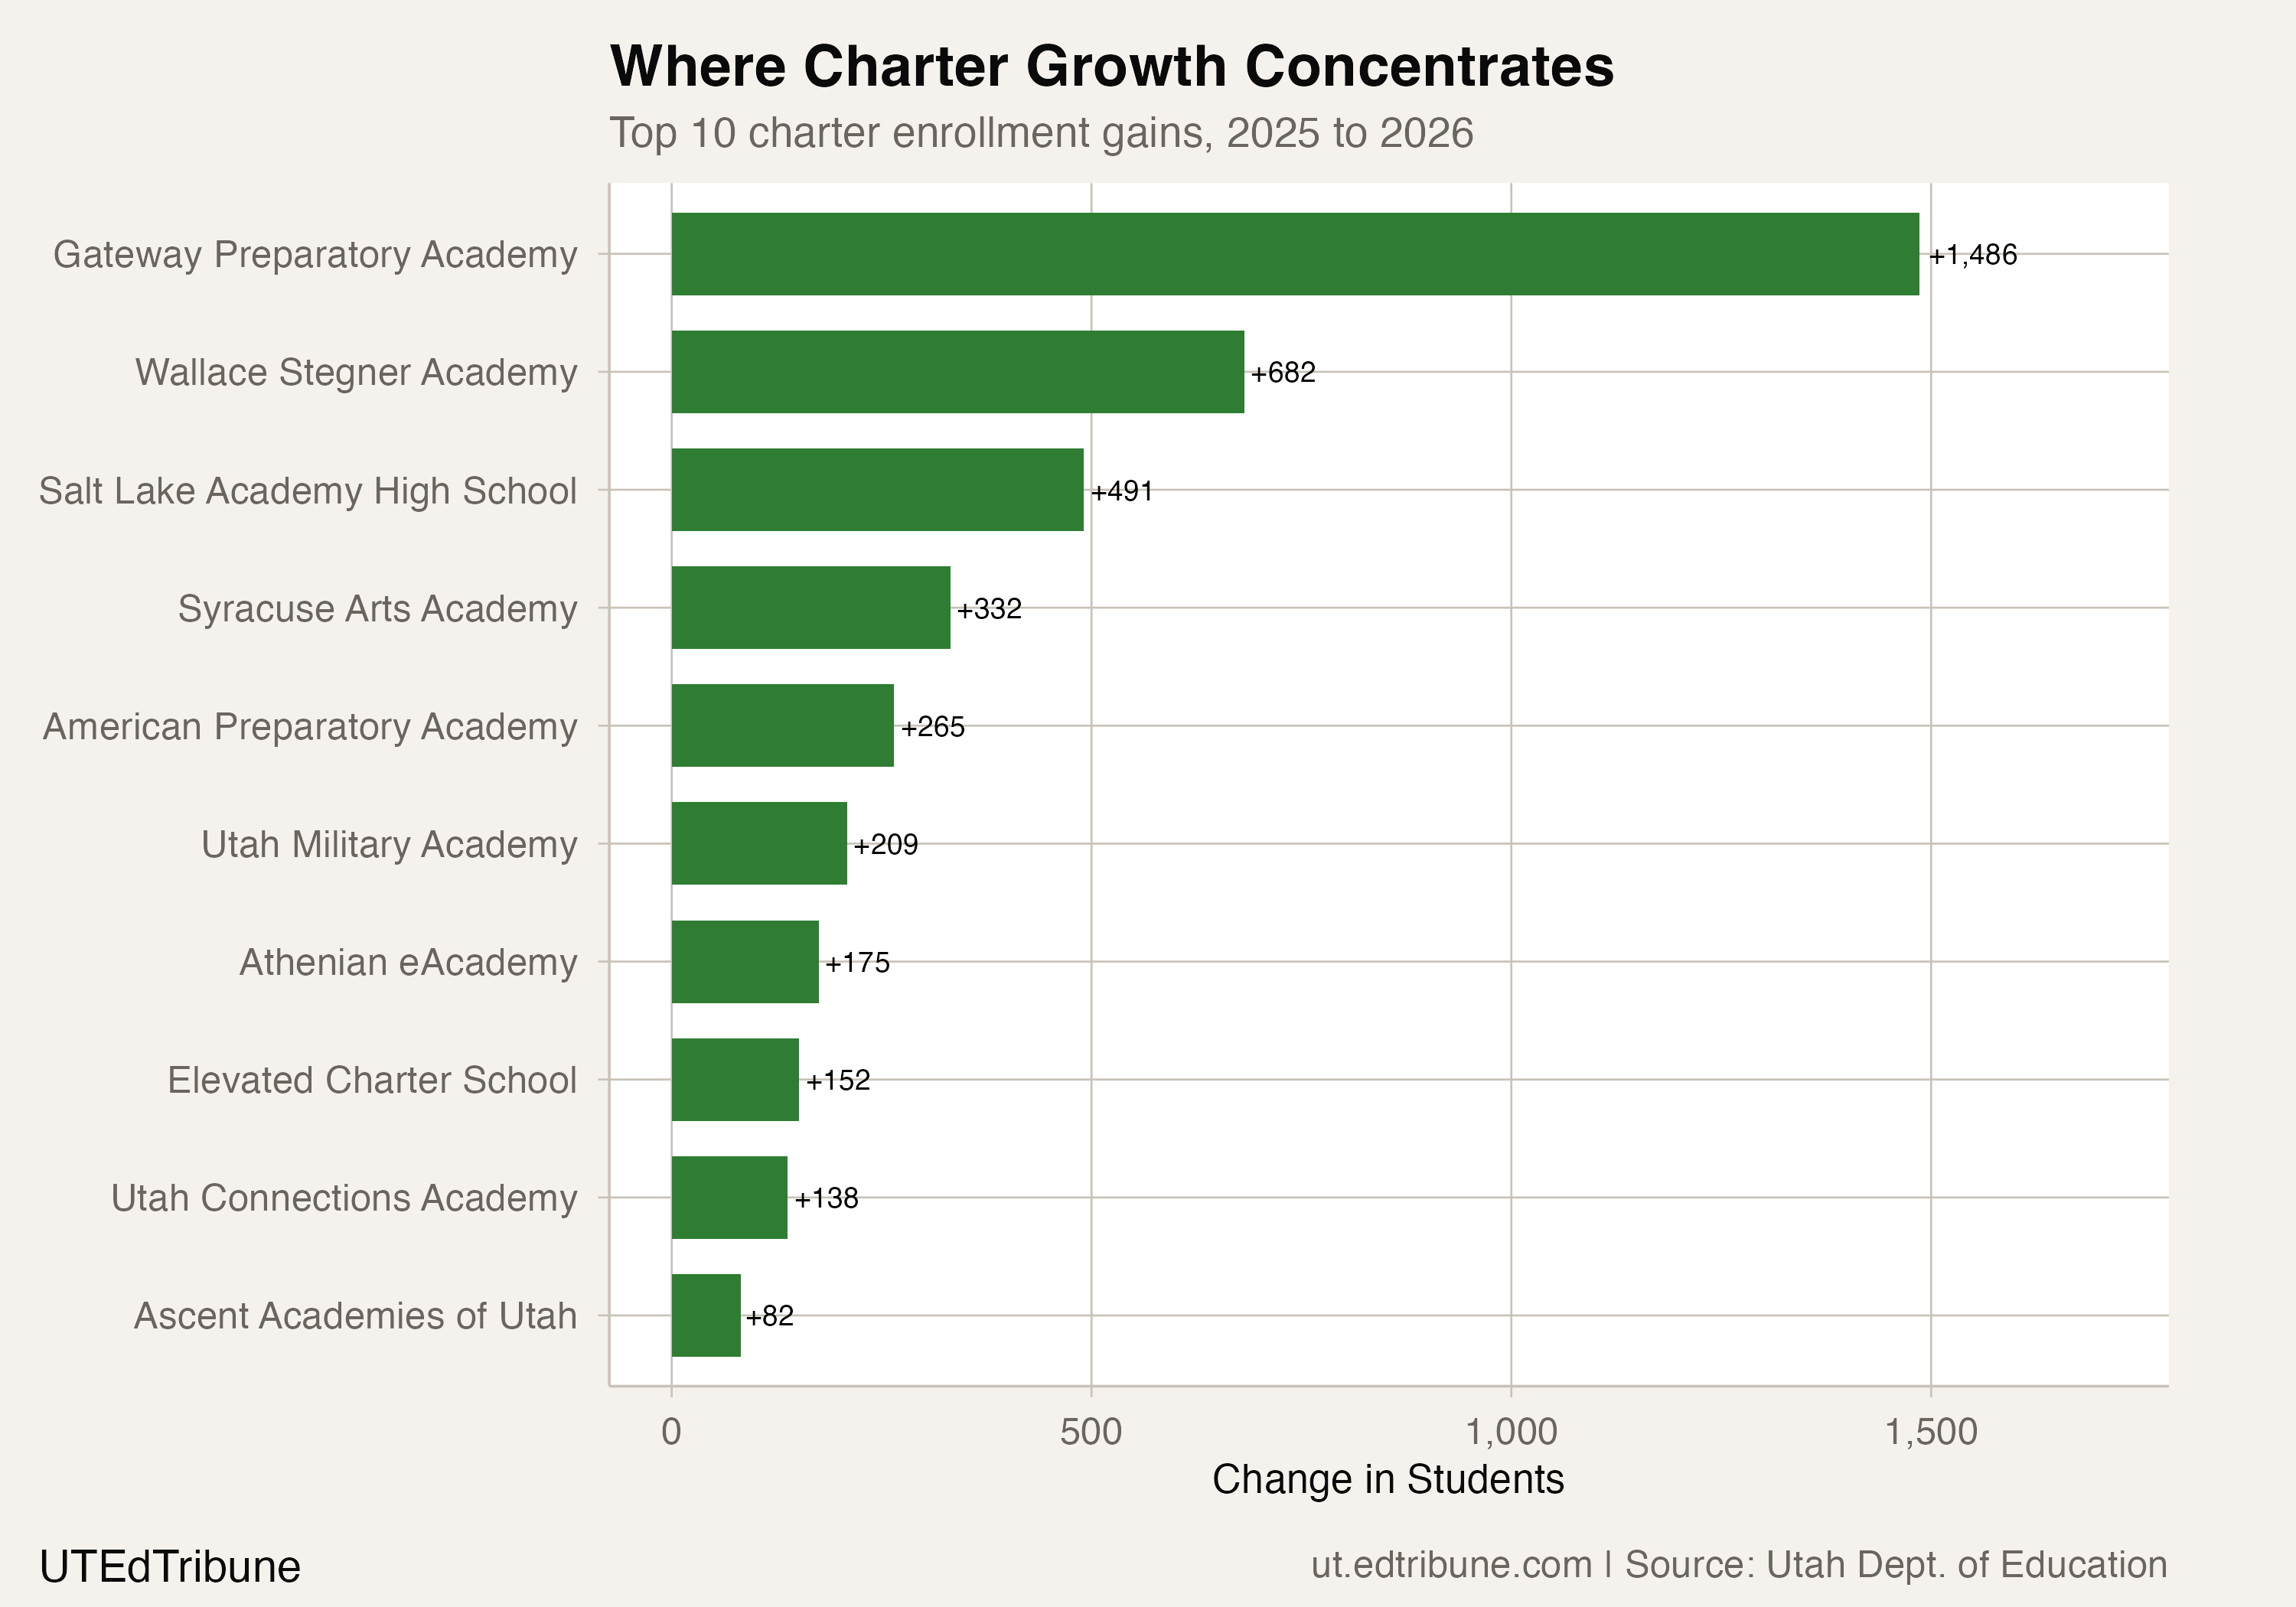
The top five charter gainers together added 3,256 students, roughly 95% of the sector's net growth. Eleven charter schools that opened after 2019 collectively enrolled 4,197 students in 2026. New school openings, not organic growth across the existing charter base, are driving the sector's expansion.
The forces pulling enrollment apart
Three structural forces are converging to widen the gap.
The most broadly documented is demographic contraction. Utah's birth rate has fallen steadily for over a decade, from 17.5 per 1,000 residents in 2013 to 13.0 in 2023. The Kem C. Gardner Policy Institute projects that the school-age population will decline through 2035, even as the state's overall population grows. Traditional districts, which are geographically fixed, bear the brunt of shrinking birth cohorts in their attendance zones. Charters, which draw from wider catchment areas, can partially offset local demographic decline.
State Superintendent Molly Hart framed the enrollment picture in broad terms.
"Utah's enrollment trends mirror the broader demographic shifts we're seeing nationwide: smaller birth cohorts, slowing in-migration, and increased school choice." -- The Salt Lake Tribune, Oct. 2025
The second force is the Utah Fits All scholarship program. Now in its second year, the voucher program awarded scholarships to more than 14,000 students for 2025-26. In its first year, roughly 80% of recipients were homeschoolers; in its second year, the split shifted to approximately half private school, half homeschool. The state does not track whether voucher recipients previously attended public schools, making the program's direct impact on public enrollment difficult to isolate. The program was ruled unconstitutional by a district court but continues to operate pending Utah Supreme Court review.
The third force is active charter expansion. The State Charter School Board authorized new campuses for multiple existing charter networks in 2025, and Gateway Preparatory's approved expansion alone is designed to absorb 2,000 students. This is supply-driven growth: new seats creating new enrollment, not just families switching sectors.
Who attends charters, and who does not
The demographic profiles of the two sectors overlap substantially but are not identical. In 2026, 61.6% of charter students were white, compared with 69.9% in traditional districts. Hispanic students comprised 26.3% of charter enrollment versus 21.0% in traditional districts. Economically disadvantaged students made up 28.2% of charter enrollment and 28.4% of traditional, essentially identical.
The largest gap is in special education: 15.3% of charter students receive special education services, compared with 13.4% in traditional districts. English learner shares are also similar, at 9.0% for charters and 8.9% for traditional districts.
These figures undercut the common assumption that charters serve a less complex student population than traditional districts. In Utah, charter and traditional schools serve similar proportions of students from low-income families and students learning English, though charters enroll a somewhat more diverse student body by race.
What the share trajectory signals
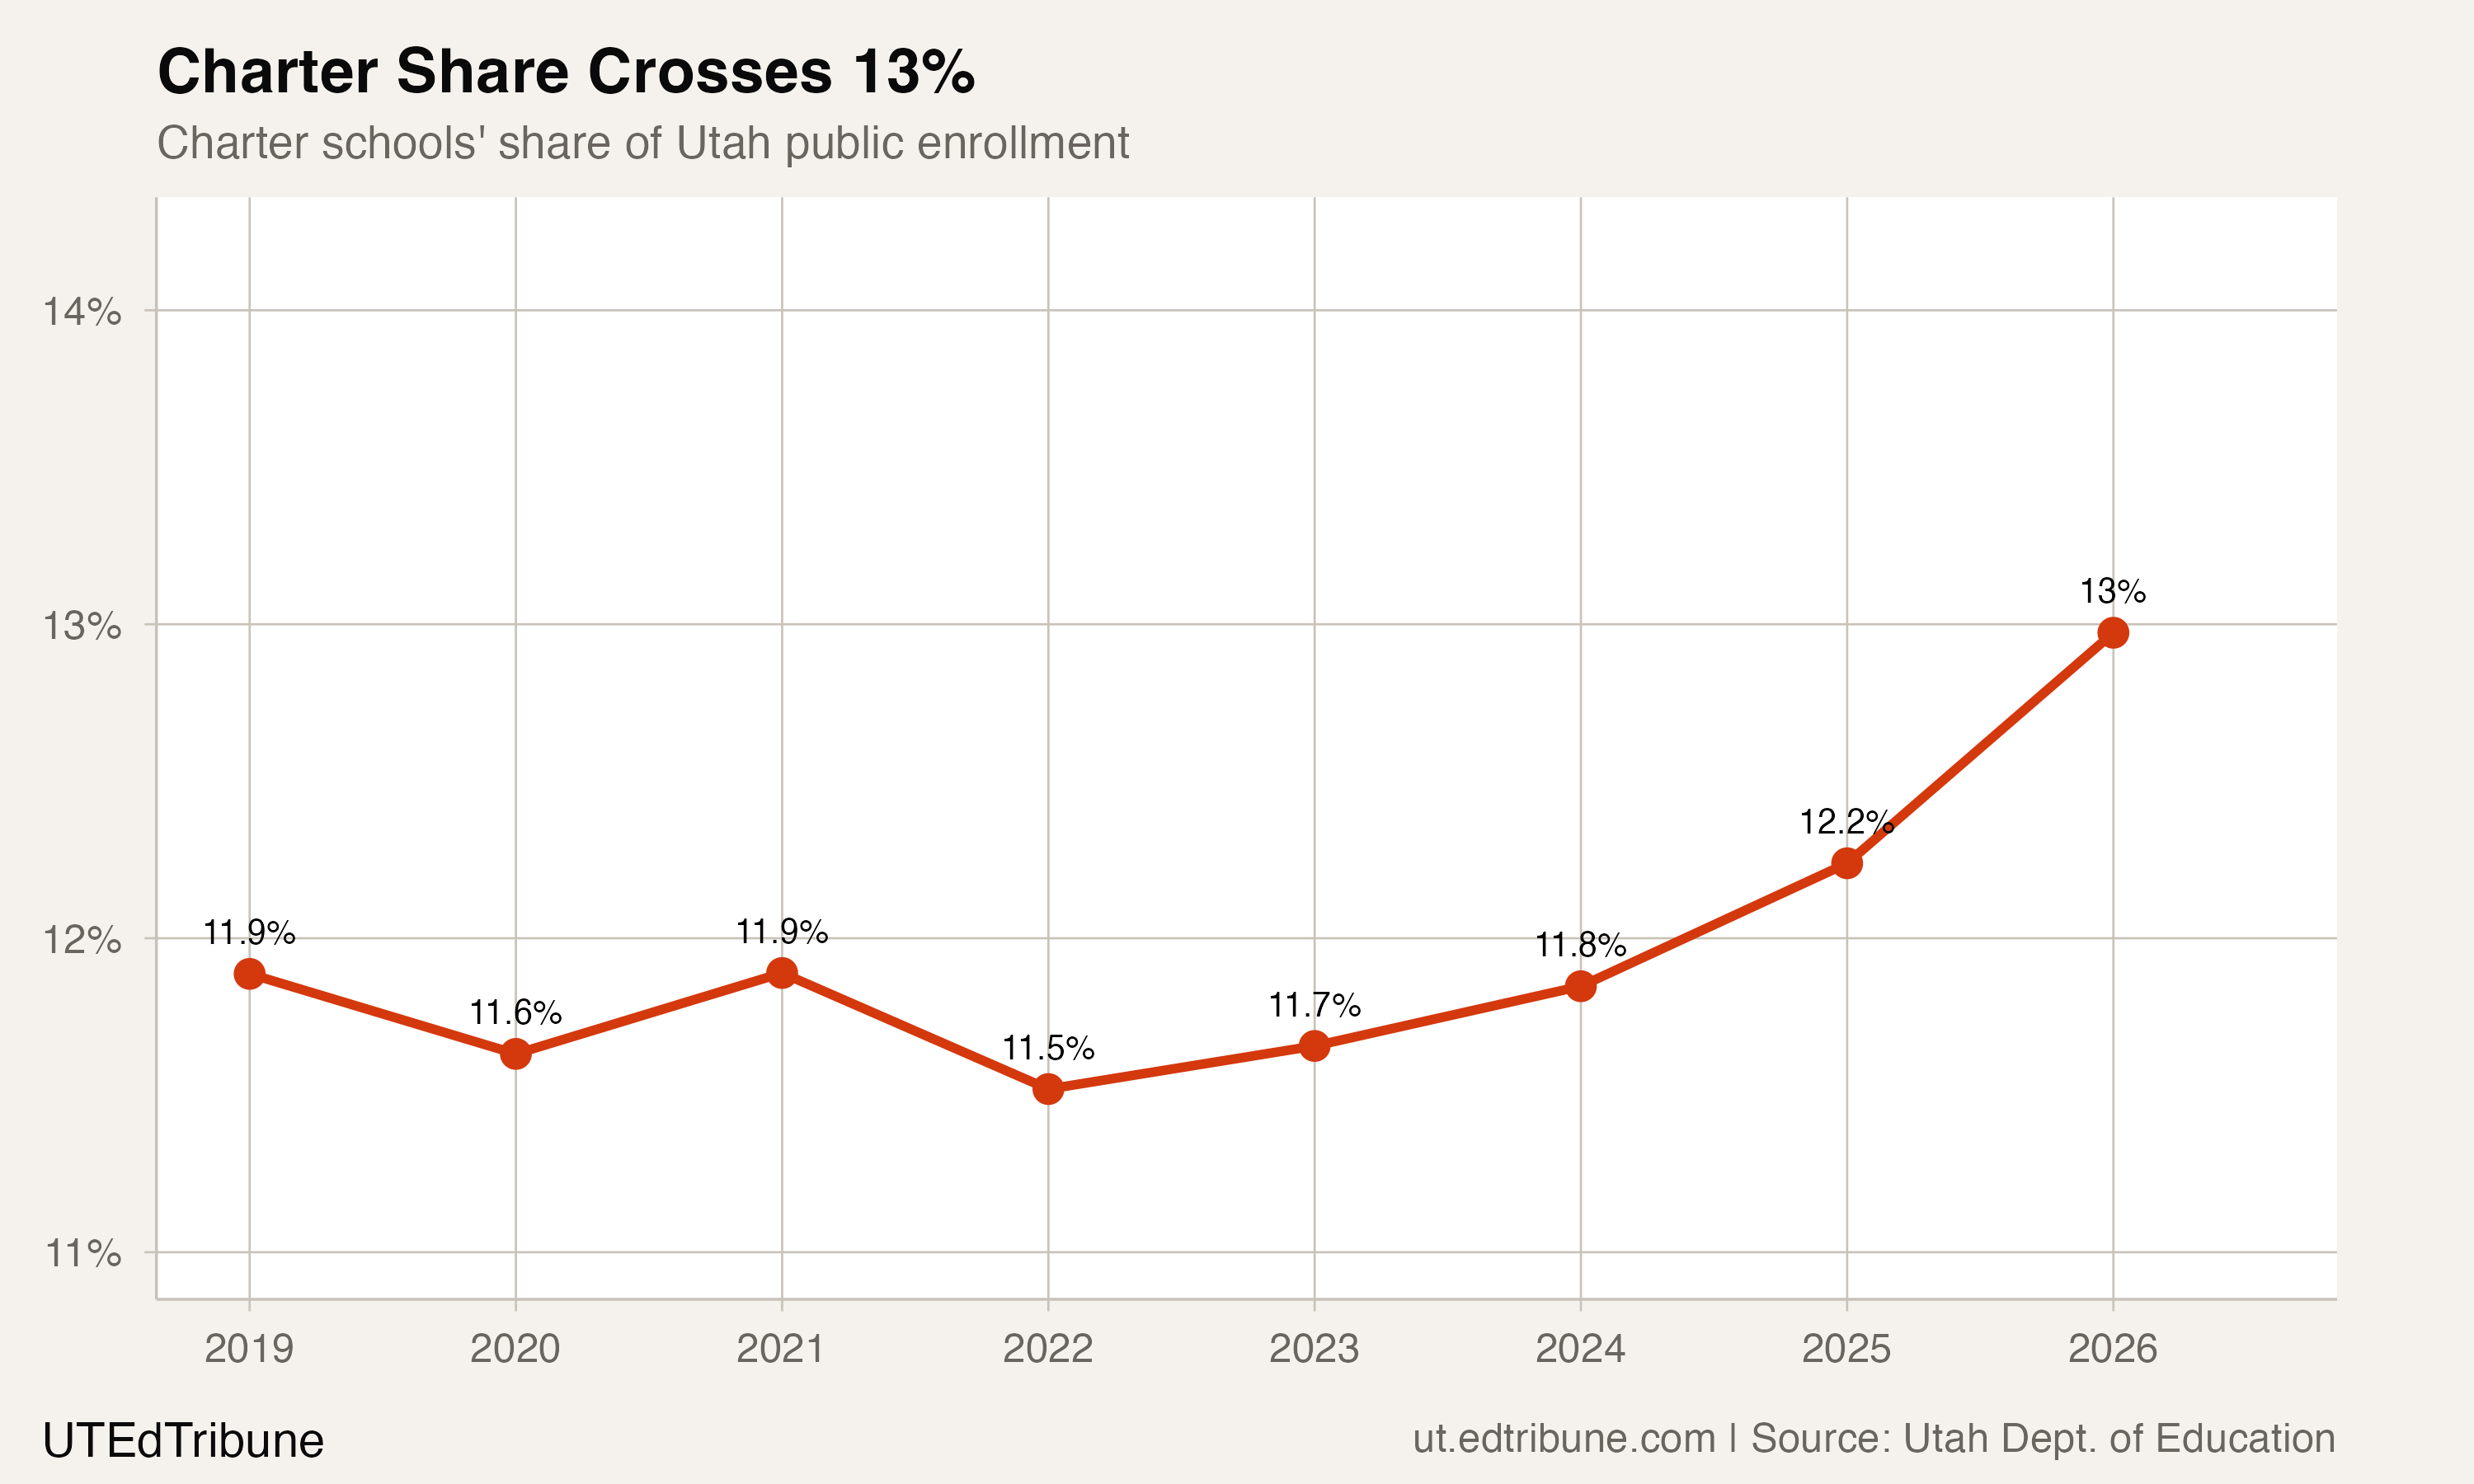
Charter schools' share of public enrollment hovered between 11.5% and 11.9% from 2019 through 2024. In two years, it jumped to 13.0%. If the current growth trajectory holds, Utah's charter share could approach 15% within three years, though the pace depends on both new charter authorizations and the trajectory of traditional district enrollment.
Every percentage point of charter share represents roughly 6,500 students. At $4,674 per Weighted Pupil Unit, the per-student allocation that drives Utah's school funding formula, each point of share shift moves approximately $30 million in base funding between sectors. Traditional districts that are simultaneously losing students and absorbing higher proportions of students whose instructional programs carry higher per-pupil costs face a structural mismatch: declining revenue against stable or rising service obligations.
Granite District offers a preview of where this leads. The district has already closed three elementary schools and plans to close six to eight more over the next decade. With 2,571 fewer students in 2025-26 alone, that timeline may compress.
Utah's data cannot distinguish between families choosing charters over their local district and families who would have left for private schools or homeschooling anyway. Both dynamics are probably at work. What the data does show: 113 charter schools are growing their combined enrollment at the fastest rate in the dataset, while 37 of 41 traditional districts are shrinking at rates many of them have never experienced. Granite's 10 school closures in seven years and the State Charter School Board's simultaneous approval of new campus expansions tell the story in buildings, not just bar charts.
Detailed code that reproduces the analysis and figures in this article is available exclusively to EdTribune subscribers.
Discussion
Sign in to join the discussion.
Loading comments...