Utah's public schools lost 18,340 students over the past three years. In the same period, special education enrollment grew by 6,605. The system is shrinking, but the part of it that requires the most intensive staffing and the highest per-pupil spending is expanding faster than at any point in the state's history.
One in every 7.3 Utah students now receives special education services. A decade ago, the ratio was 1 in 9.2.
A 12-year divergence
From 2014 to 2026, total enrollment in Utah's public schools grew 7.2%, from 612,088 to 656,310. Special education enrollment grew 34.4%, from 66,884 to 89,893. The compound annual growth rate for special education, 2.5% per year, outpaced overall enrollment growth of 0.6% per year by more than four to one.
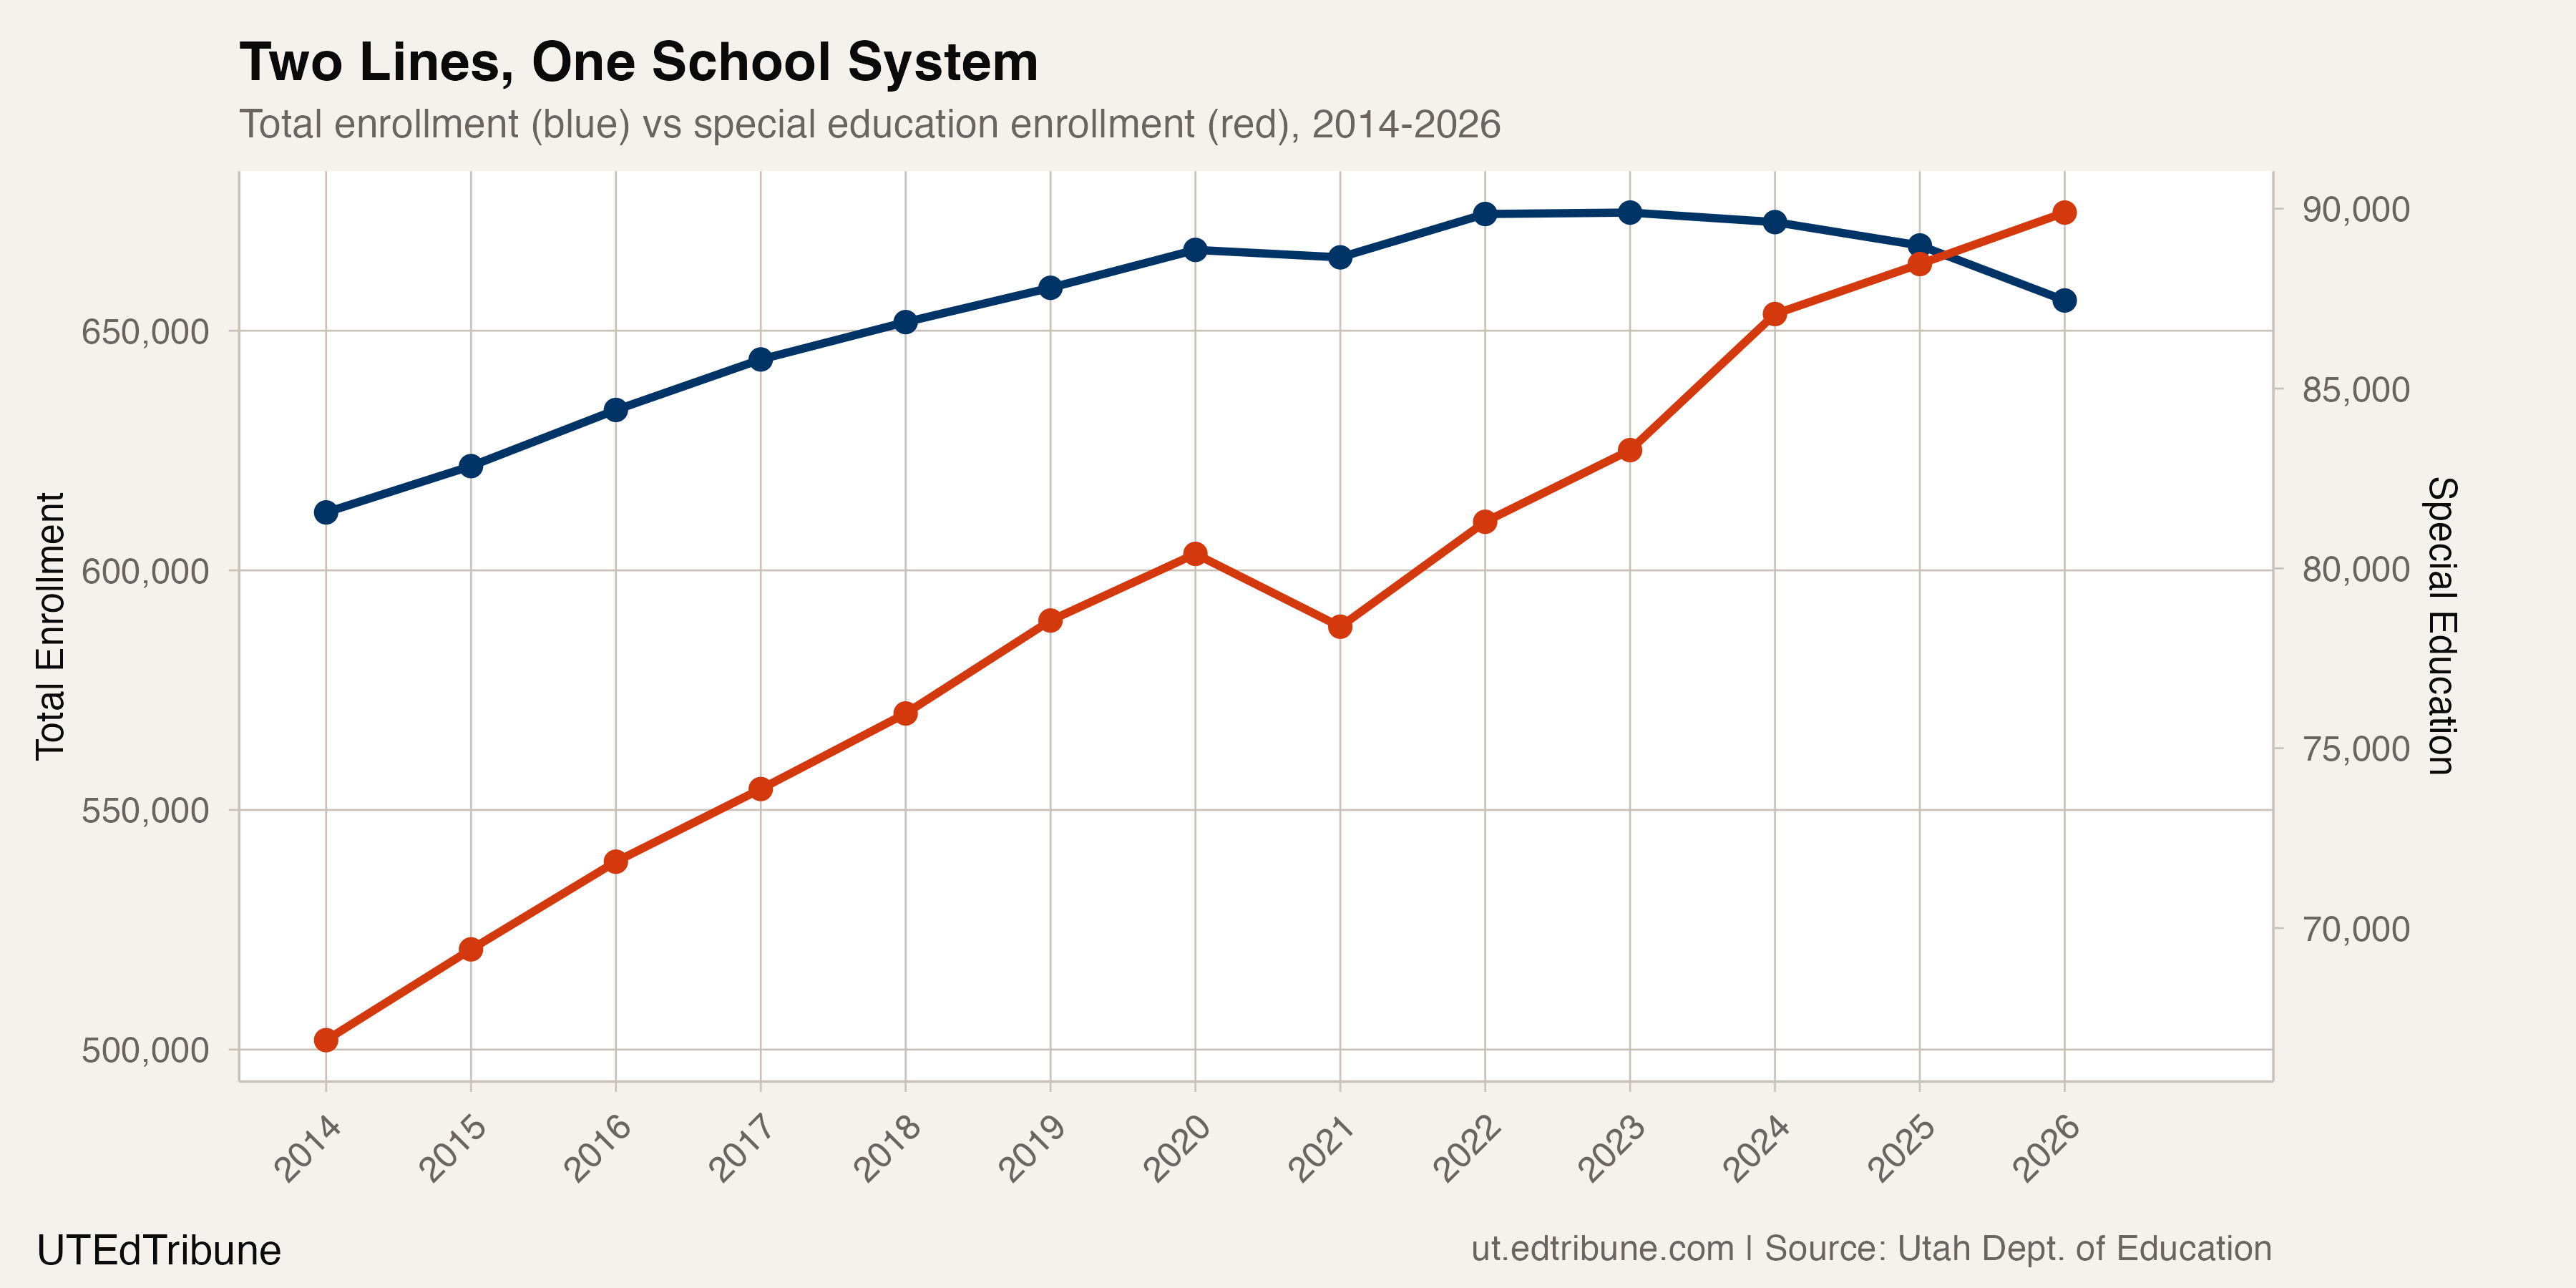
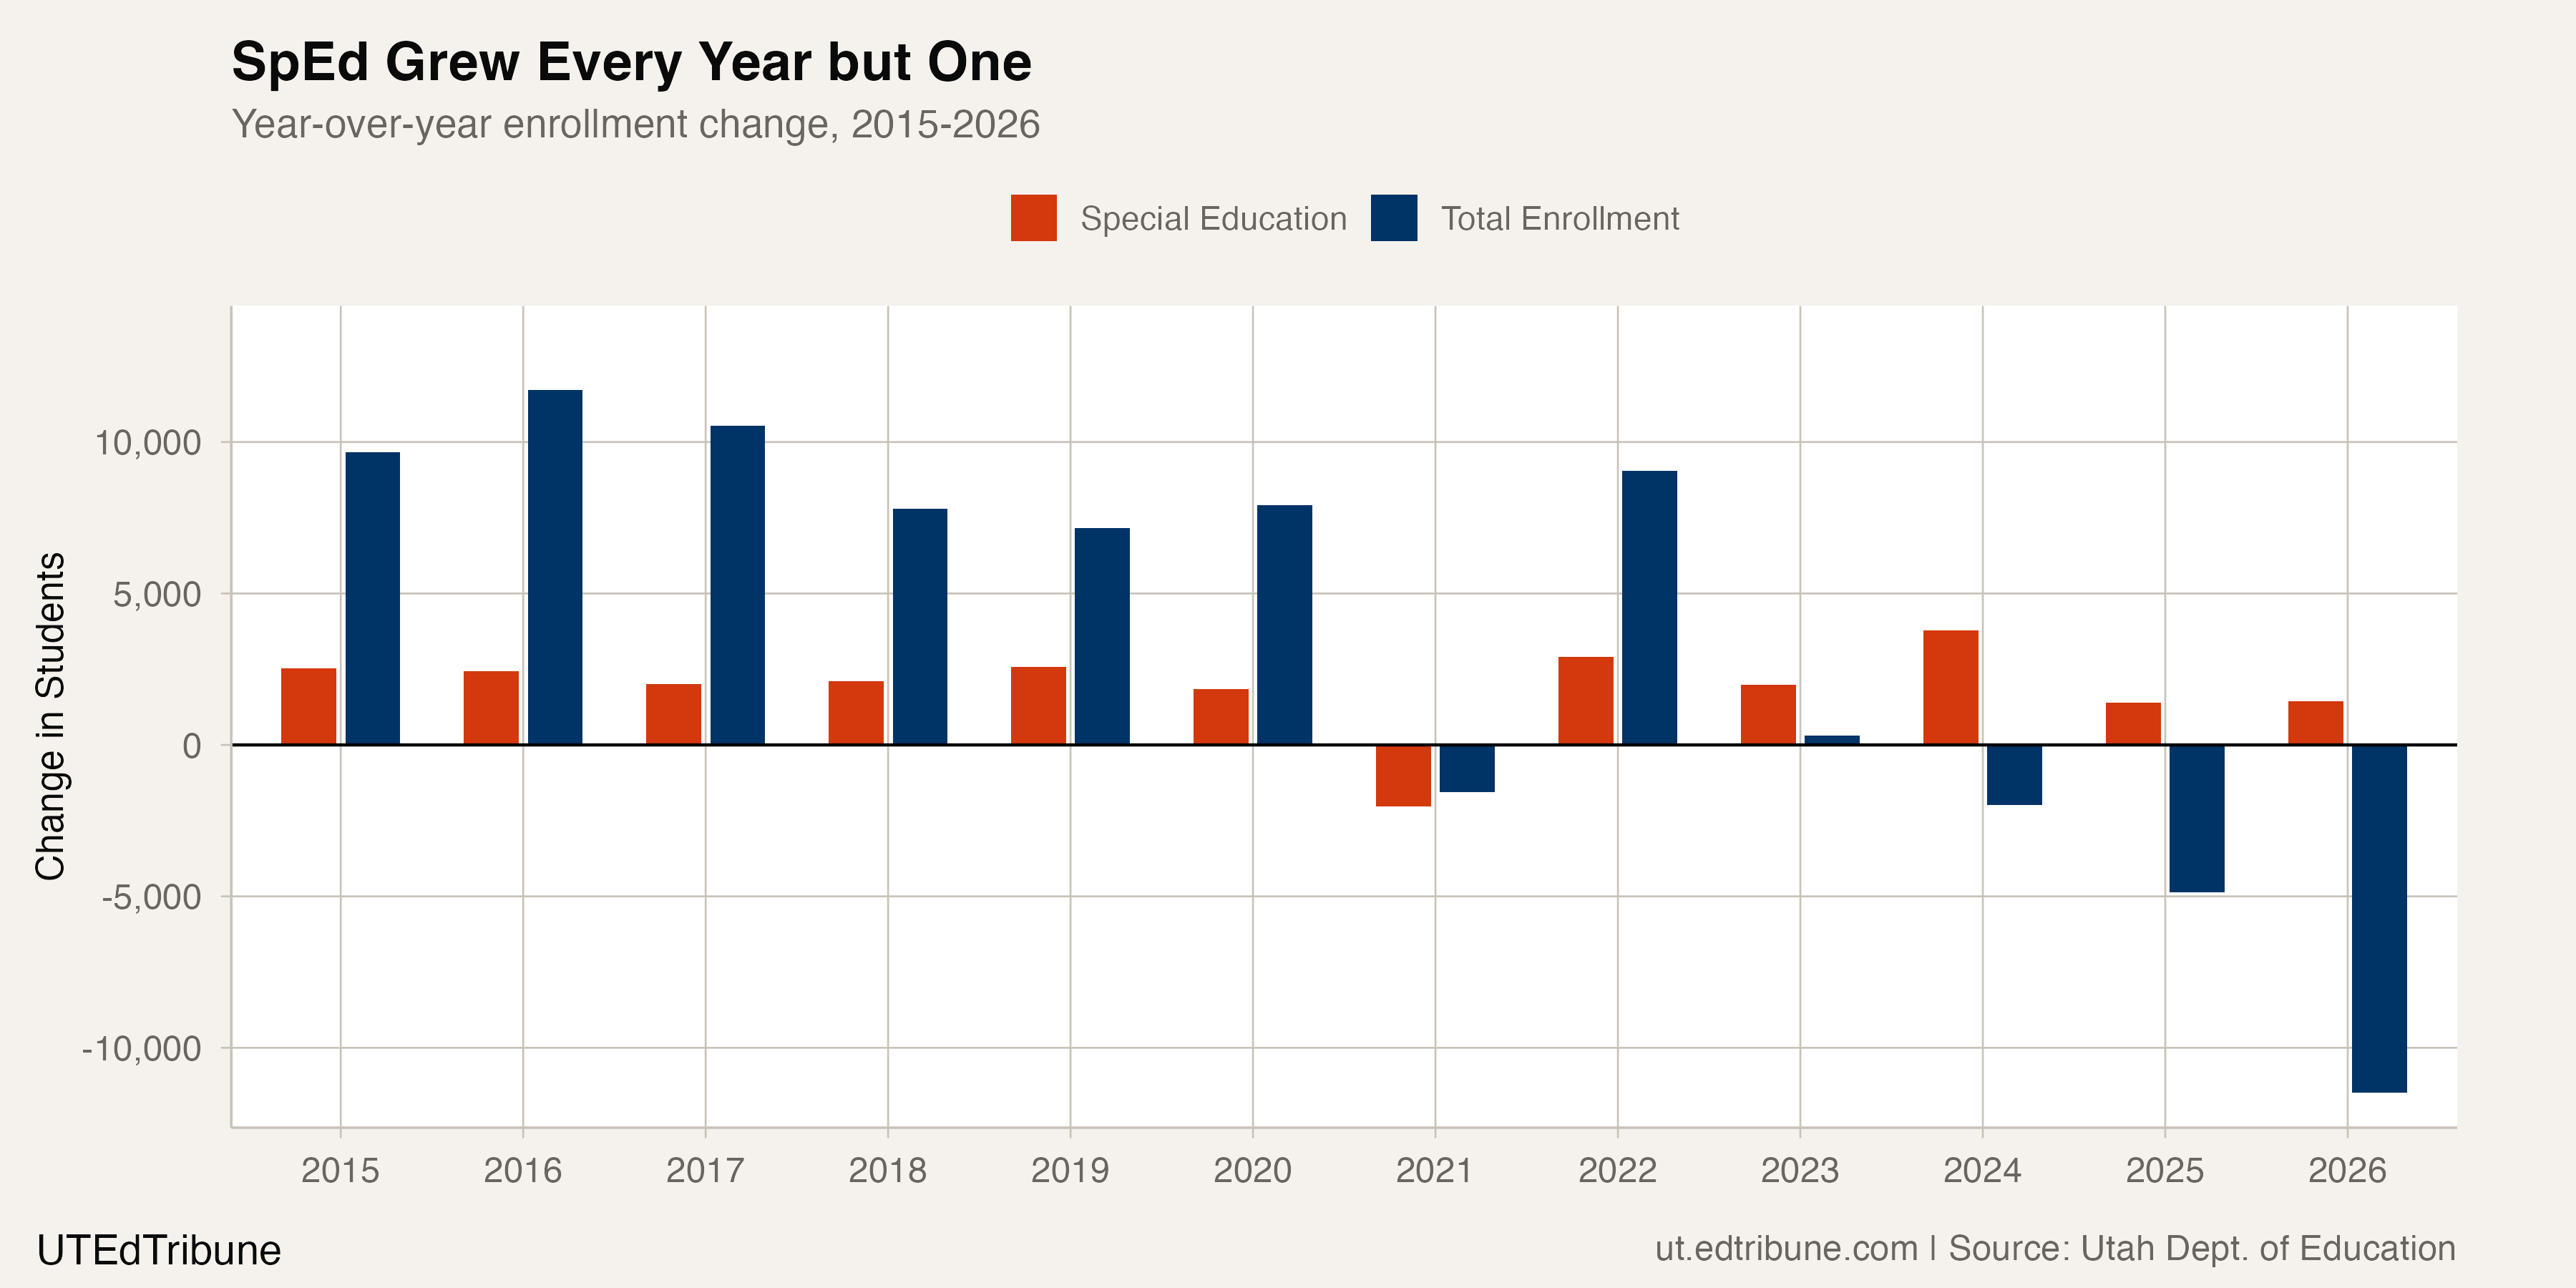
That gap widened as enrollment began falling. Total enrollment peaked at 674,650 in the 2022-23 school year and has dropped in each of the three years since. Special education grew every single one of those years. In the period from 2023 to 2026, the non-special-education student population fell by 24,945 while special education added 6,605.
The only year in the 12-year series when special education enrollment declined was 2020-21, during pandemic-era disruptions, when it fell by 2,024 students. It recovered in a single year and resumed climbing.
Above the funding line
Special education's share of total enrollment has risen from 10.9% to 13.7%, an acceleration that has fiscal consequences baked into state law. Utah's funding formula caps the special education add-on at a prevalence limit of 12.18% of a district's total enrollment. Students above that threshold are served but not funded through the add-on formula.
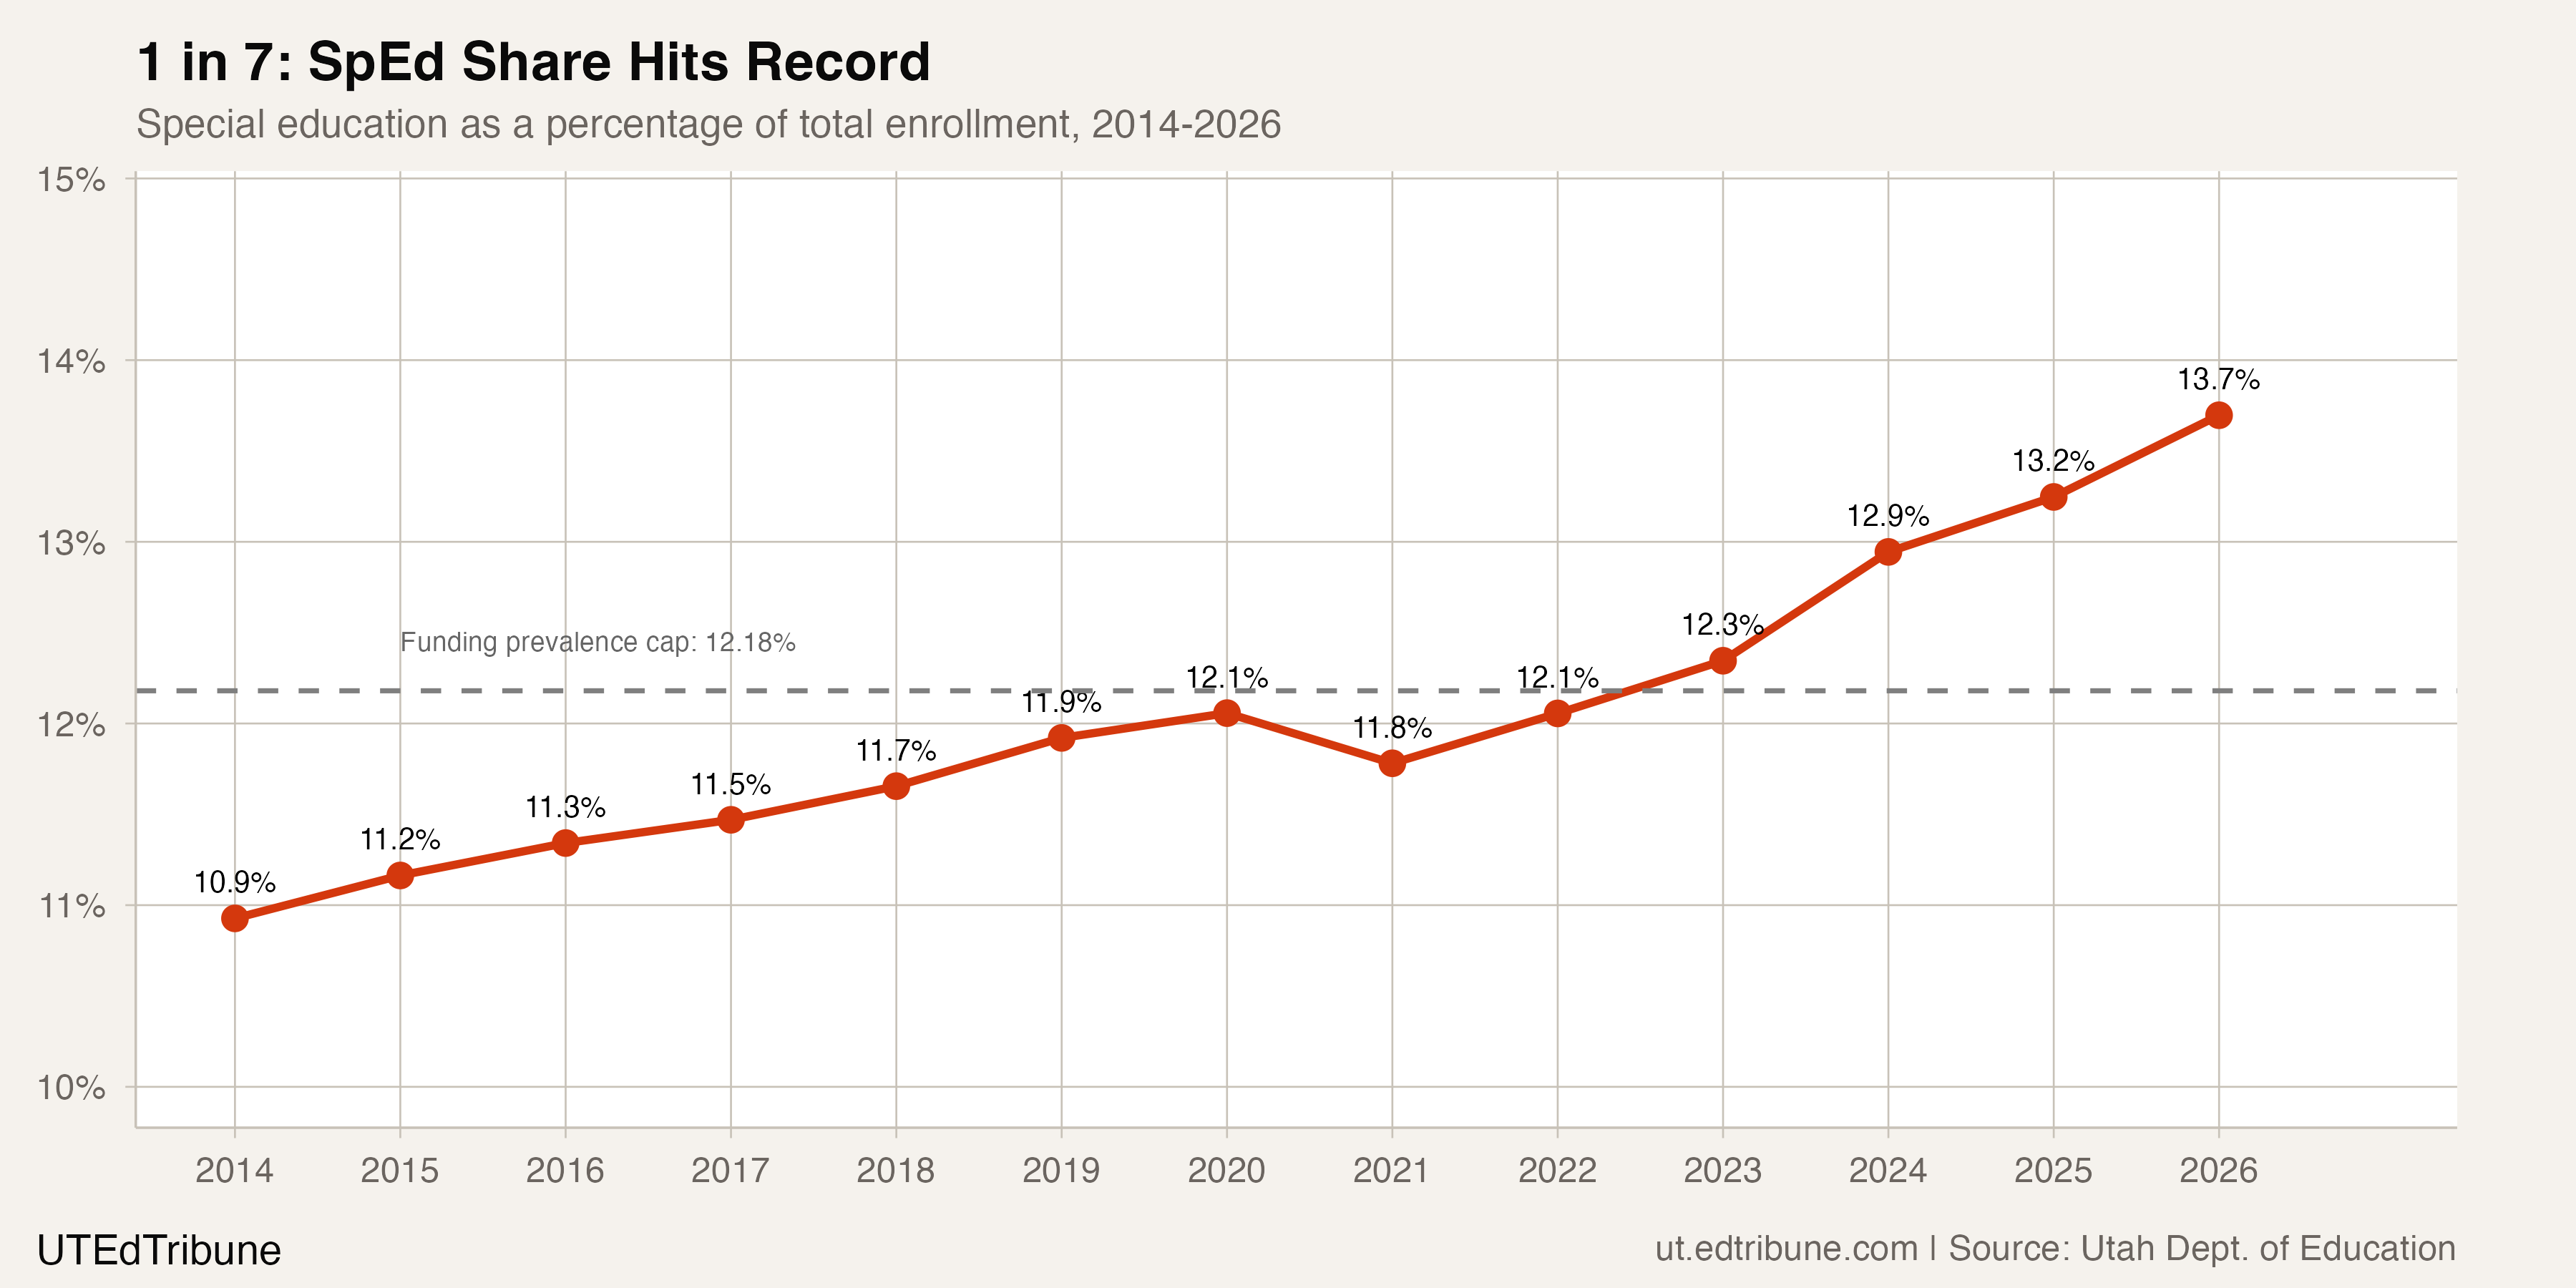
The statewide rate first crossed that 12.18% cap in 2023 and has not come back down. At 13.7%, the gap between actual prevalence and the funded ceiling is now 1.5 percentage points, representing roughly 10,000 students whose instructional programs carry costs that the special education add-on does not fully recognize.
The 2024 school year produced the single largest one-year SpEd increase on record: 3,784 new special education students, pushing the share up 0.6 percentage points in a single year. That spike accounted for more than a third of the entire three-year growth.
What is driving this
Utah recorded the largest percentage increase in students with disabilities of any state in the country between 2000-01 and 2021-22, a 65% growth rate that outpaced every other state. The growth has continued since.
The most likely driver is expanded identification, not a sudden increase in the prevalence of disabilities. Nationally, the number of students qualifying for services under the Individuals with Disabilities Education Act rose 3.8% in 2024 alone, with autism accounting for 40% of the total increase. Education researchers attribute this to broader screening, earlier identification of autism spectrum disorder and ADHD, and heightened attention to children's mental health following the pandemic.
A competing explanation is demographic: Utah's declining birth rate, which has fallen steadily since 2008 from the nation's highest to a fertility rate of 1.8, means smaller incoming cohorts. If identification rates hold constant on a shrinking base, the percentage rises mechanically even without any change in practice. The data cannot distinguish between the two.
Where the growth is concentrated
At the district level, Alpine and Jordan account for a disproportionate share. Alpine added 1,904 special education students between 2019 and 2026, a 23.8% increase. Jordan added 1,820, a 29.5% increase. Together, those two suburban districts along the Wasatch Front account for 32.8% of the statewide special education growth over that period.
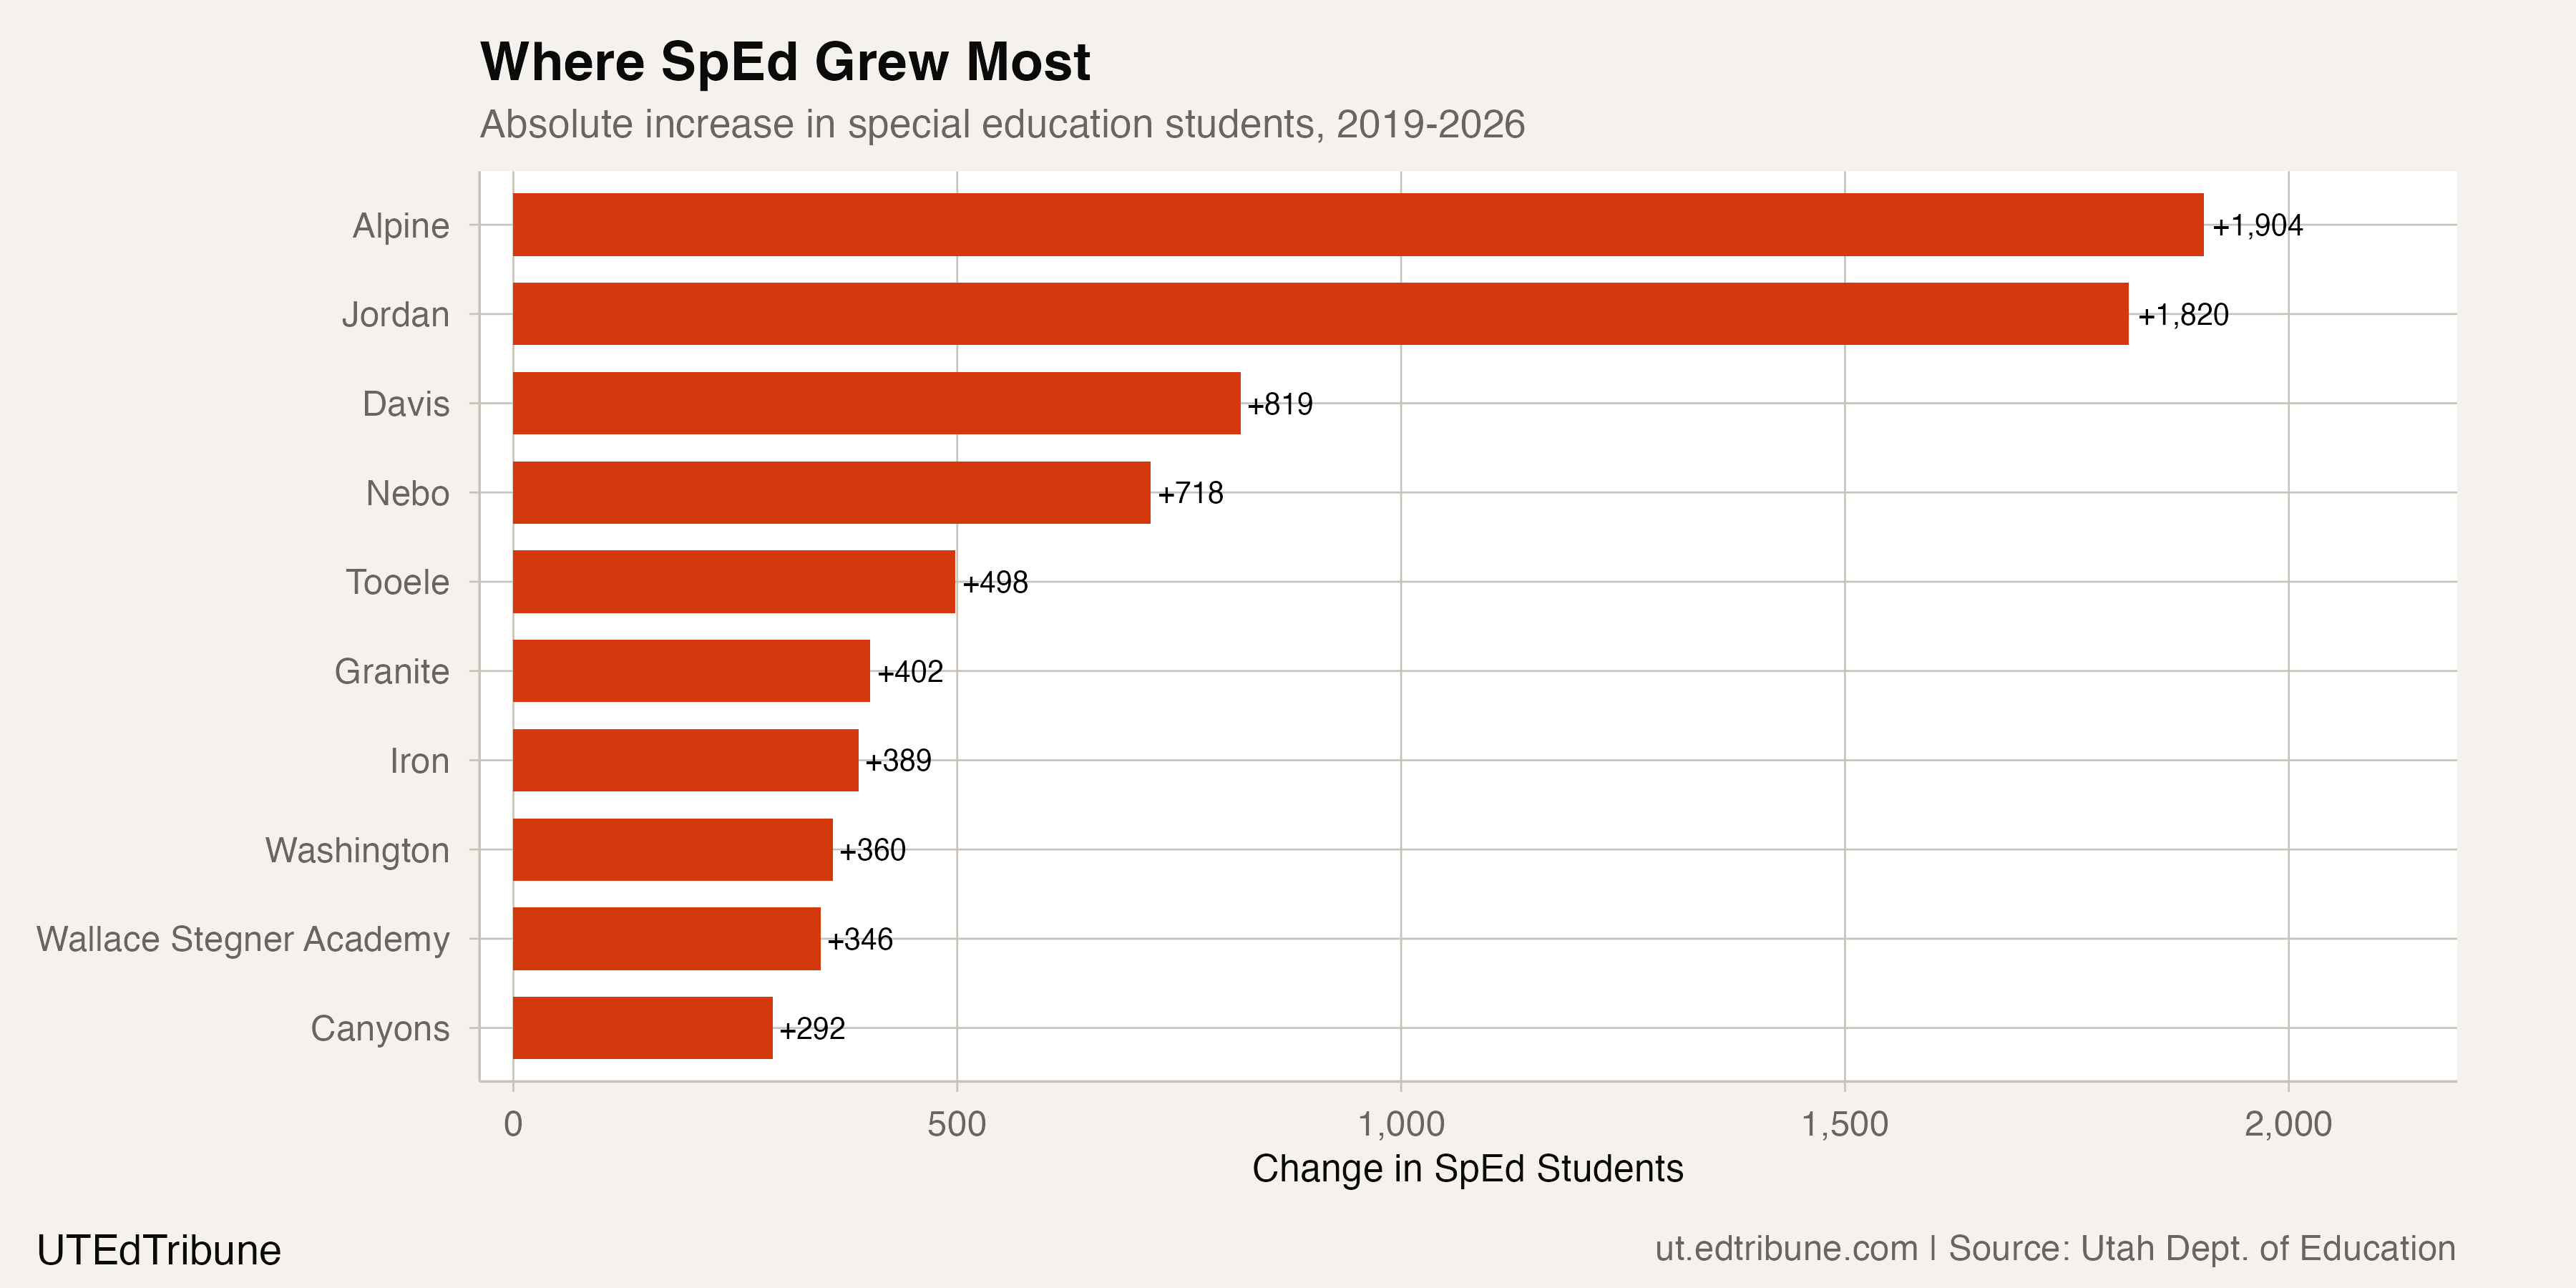
Davis, the state's second-largest district by SpEd headcount at 9,793 students, grew at a more modest 9.1%. The variation suggests that identification practices differ meaningfully across districts, not just across years.
The charter dimension
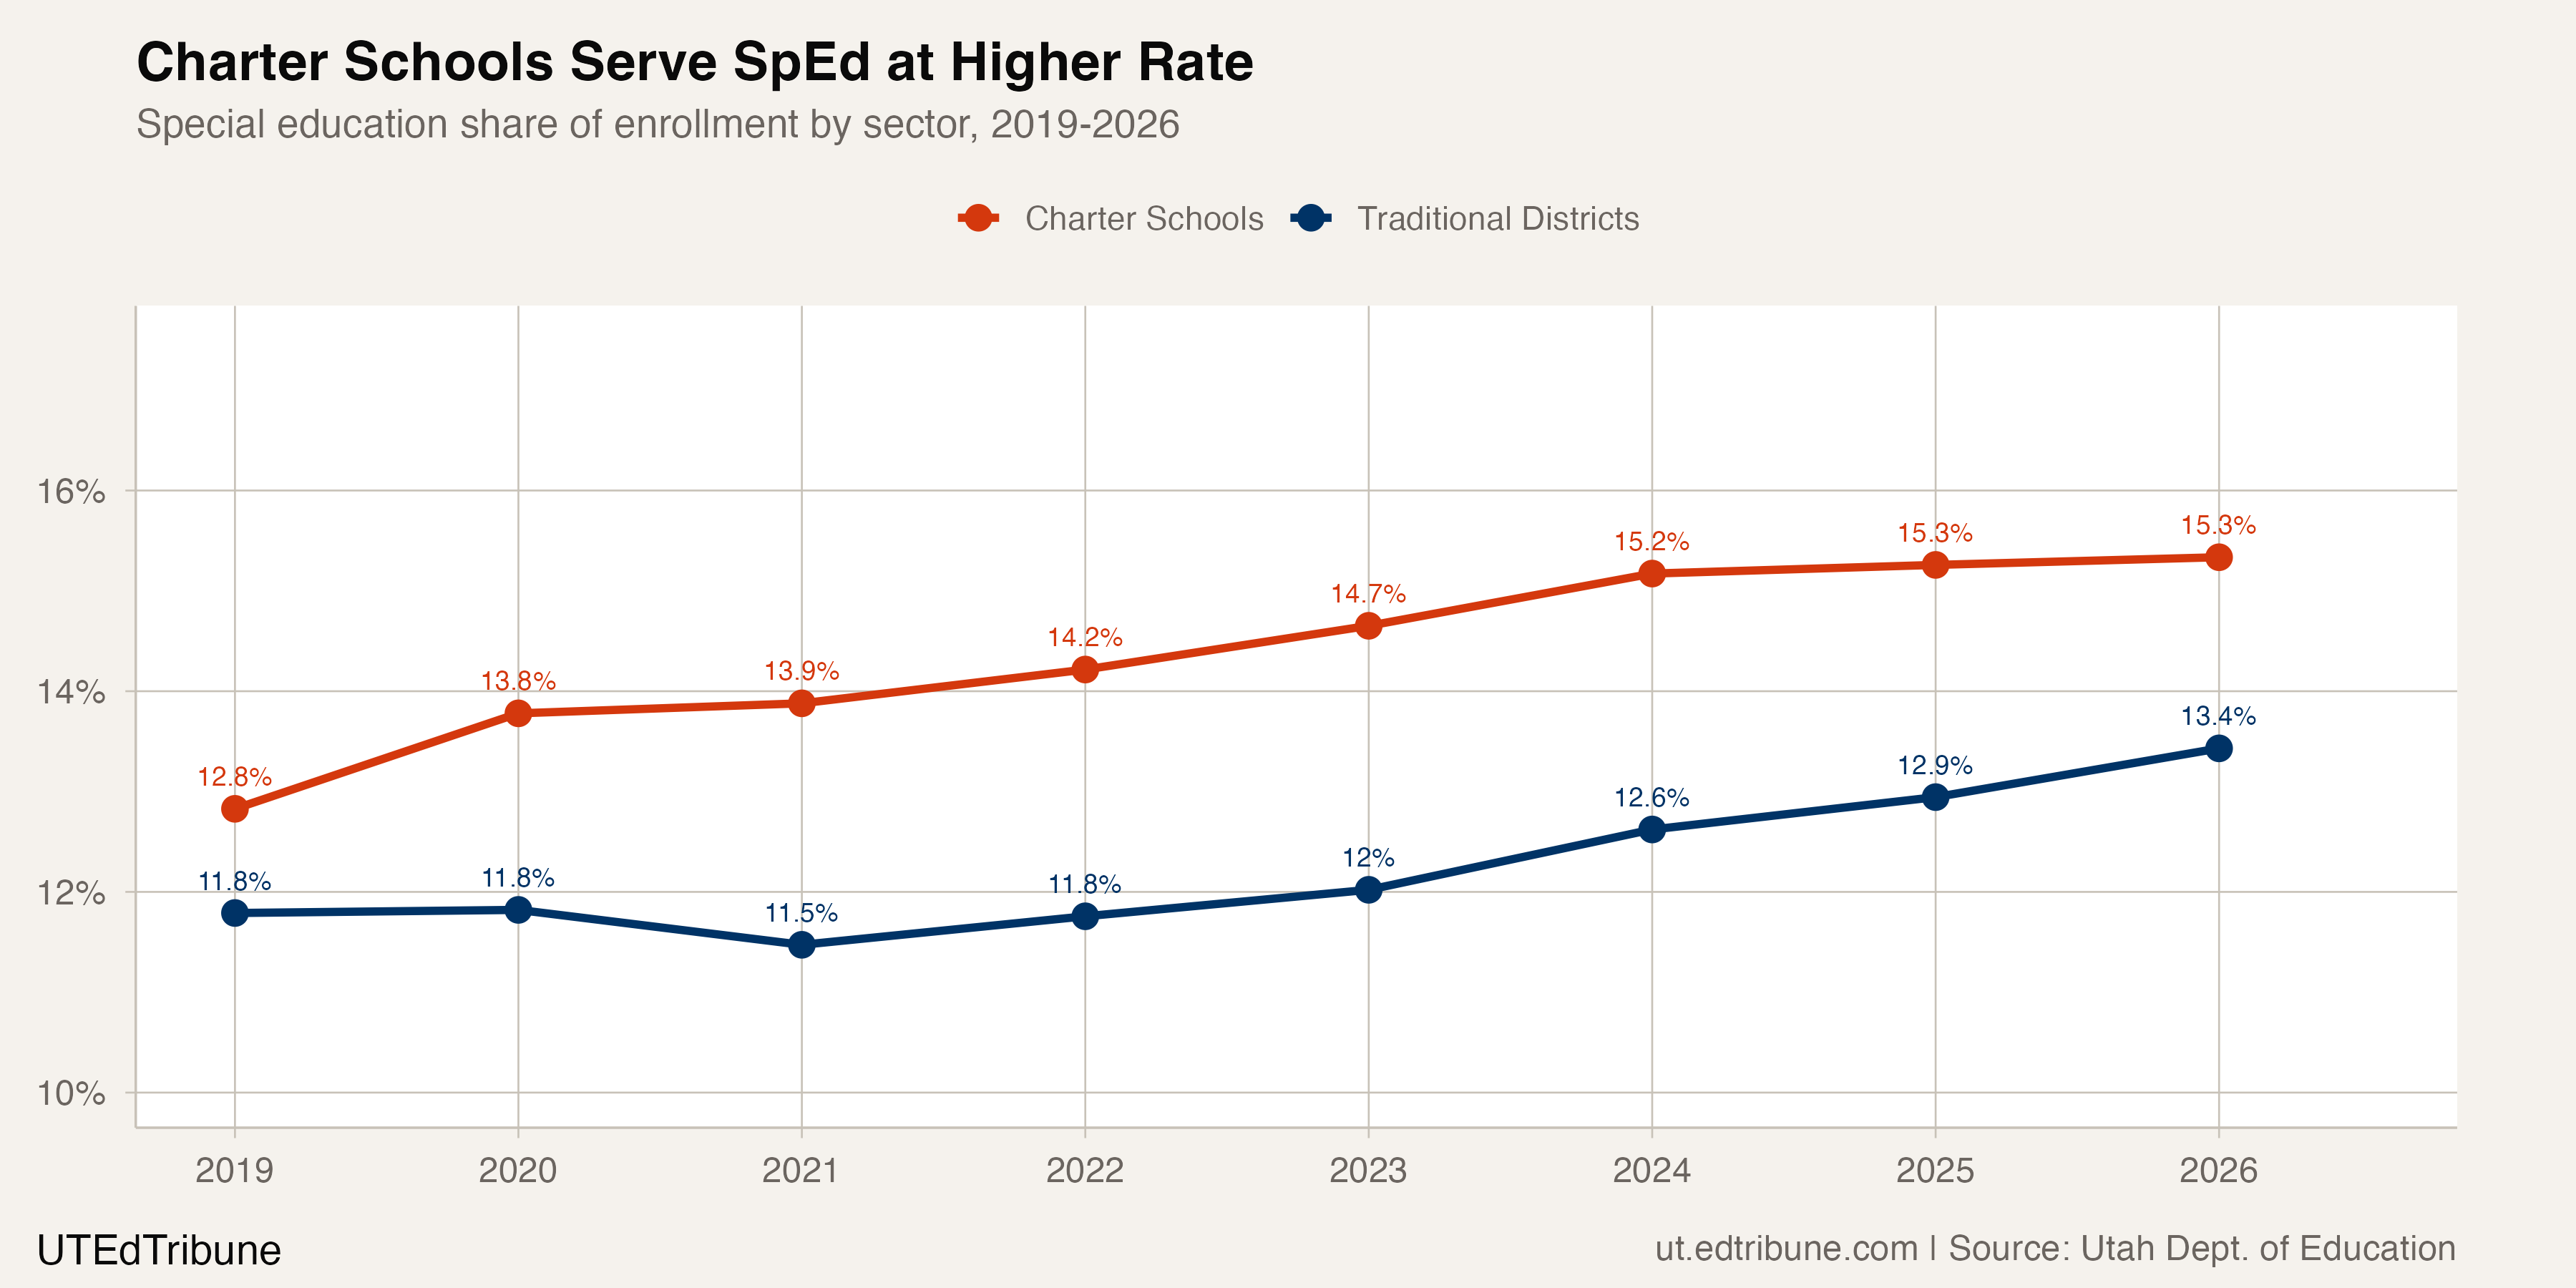
Charter schools in Utah serve special education students at a higher rate than traditional districts: 15.3% versus 13.4% in 2026. That gap has persisted since at least 2019, when charter SpEd share was already 12.8% compared to 11.8% in traditional districts.
One charter explains much of this. Spectrum Academy, a charter school founded in 2006 by parents of children with autism, enrolls 1,572 students across five campuses along the Wasatch Front. Of those, 1,272, or 80.9%, receive special education services. It is the only school in Utah where special education students constitute a majority of enrollment. Spectrum Academy alone accounts for roughly 10% of all charter-sector special education students.
The school's model, tuition-free public education designed specifically for students with autism and related neurodevelopmental conditions, has attracted families who found traditional district placements inadequate. But it has also drawn federal scrutiny: a 2023 investigation by the Department of Education's Office for Civil Rights found hundreds of instances of restraint and seclusion across Spectrum's campuses in the 2017-18 and 2018-19 school years. The academy agreed to revise its policies.
A structural mismatch
"Our educational responsibilities are growing more complex as a greater share of students require specialized supports." Superintendent Molly Hart, KSL, Feb. 2026
The state's funding formula was designed for a world where special education represented about 12% of enrollment. That threshold now sits 1.5 percentage points below reality. Each special education student is funded at 2.53 weighted pupil units, compared to 1.0 for a general education student. At the FY2026 WPU value, that weighting translates to significantly higher per-pupil costs for instructional programs, related services, and compliance.
The 2026 Legislature appropriated $5 million for a "Grow Your Own Special Educators" program to help paraprofessionals earn special education credentials. The investment acknowledges a staffing pipeline problem: as the share of students entitled to individualized education programs grows, the workforce needed to write and implement those plans must grow with it.
The enrollment data cannot answer whether 13.7% represents true prevalence or expanded identification. It can establish that the trajectory has been remarkably consistent: 11 positive years out of 12, with the only interruption coming during a pandemic that disrupted every measurement in education. The funding cap was set at 12.18%. Actual prevalence is 13.7% and climbing. That gap represents roughly 10,000 students whose services the formula does not fully fund. The Legislature just invested $5 million to grow the workforce that serves them. The formula that determines how much those workers get paid has not caught up.
Detailed code that reproduces the analysis and figures in this article is available exclusively to EdTribune subscribers.
Discussion
Sign in to join the discussion.
Loading comments...